

Measuring customer service is about so much more than just tracking response times and satisfaction scores. For a Shopify brand, it's a direct strategy for boosting customer retention and, ultimately, revenue. The whole process boils down to a few key steps: figure out what you want to achieve, pick the right metrics to watch, gather the data, and then actually use those insights to make smart decisions.
Why Measuring Customer Service Is a Shopify Growth Lever
Let's be real—flying blind with your customer support is a recipe for disaster. Too many Shopify stores treat support as a necessary evil, a cost center that just deals with problems as they pop up. That reactive mindset misses the entire point. Your support inbox is an absolute goldmine of data that can inform your entire business strategy.
Ignoring this data has serious consequences. A slow reply to a simple shipping question doesn't just lose you that one sale. It could cost you a customer who would have spent hundreds with you over the next few years. Seeing the same complaint about a product's sizing over and over again isn't just another support ticket; it's a bright, flashing sign telling you how to prevent a wave of costly returns and bad reviews.
Connecting Metrics to Growth
The most successful e-commerce brands get it. They understand that how you measure customer service directly impacts your growth trajectory. They've stopped thinking about support as just closing tickets and started seeing it as an active learning opportunity. By connecting the dots between support metrics and business outcomes, they turn a cost center into a powerful revenue driver.
Think about these common scenarios:
- A flood of "Where is my order?" tickets: This isn't a signal to hire more support agents. It’s a clear sign you need to improve your automated shipping notifications or make your delivery estimates more obvious on your product pages.
- Low CSAT scores on product-related questions: This often points to confusing product descriptions or a gap between what customers expect and what they receive. Fixing the source of the confusion not only reduces tickets but can also boost your conversion rates.
The goal isn't just to answer questions faster. It’s to understand why customers are asking those questions in the first place and use that knowledge to create a better experience that prevents future issues.
In the end, effective measurement lets you get ahead of the game. You can anticipate what your customers need, refine your products, and build the kind of loyalty that turns one-time buyers into brand advocates for life. It's also the foundation for knowing how to improve customer satisfaction, creating a feedback loop that fuels repeat business. This guide will walk you through exactly which KPIs to track and how to turn them into your competitive edge.
Choosing the Right KPIs for Your Shopify Store
Not all metrics are created equal, especially when you're running a fast-paced Shopify store. It's easy to get lost in a sea of data, but the most successful brands I've seen focus on a handful of key performance indicators (KPIs) that actually tie back to their business goals.
Think of it this way: a high-end fashion brand might live and die by its Customer Satisfaction (CSAT) scores. Every single interaction needs to feel luxurious and personal. For them, CSAT is a direct measure of that premium experience. But a high-volume dropshipper selling electronics? They might be obsessed with First Response Time (FRT) to keep up with the flood of inquiries and stop potential buyers from bouncing.
The trick is picking a mix of KPIs that tells the whole story of your support performance—not just one part of it.
This isn't just about keeping customers happy; it's about driving real business results. As you can see below, measuring your customer service is a direct path to growth and increased revenue.
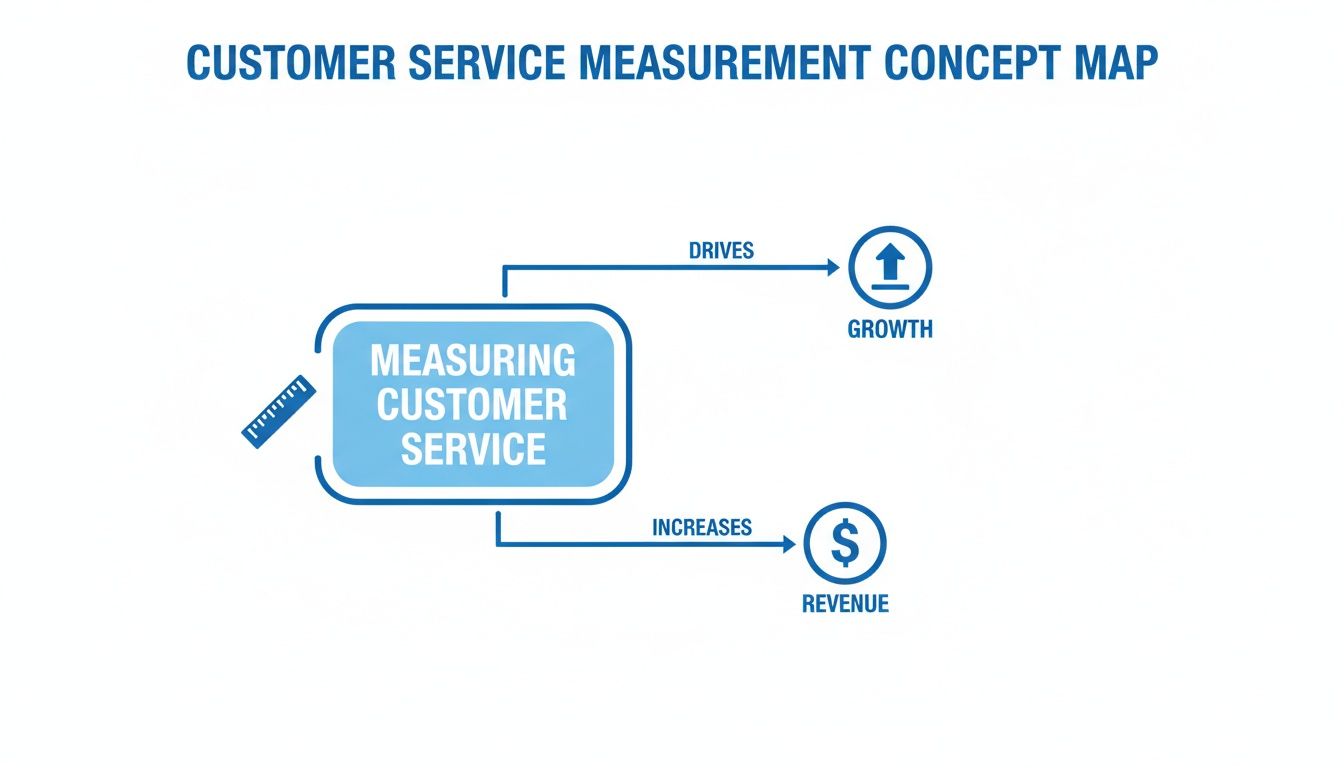
This visual drives home a crucial point: your KPIs aren't just numbers on a screen. They're levers you can pull to scale your brand and boost your bottom line.
Balancing Quality and Efficiency Metrics
A great way to start is by splitting your KPIs into two buckets: quality and efficiency. Quality metrics tell you how well you're serving customers, while efficiency metrics tell you how quickly and effectively you're doing it.
- Quality Metrics: These get to the heart of customer sentiment and the actual effectiveness of your support. They're what build long-term loyalty and create brand advocates.
- Efficiency Metrics: These track the speed and resourcefulness of your team. They're essential for managing costs and making sure your support can scale as you grow.
Finding the right balance is everything. Being super-efficient without a focus on quality just leads to fast, unhelpful answers. On the flip side, providing amazing support that's too slow and expensive isn't a sustainable model.
If you're just getting started, something as simple as tracking various customer satisfaction metrics in Excel can be a fantastic way to build a foundation before you invest in more specialized tools.
Essential Customer Service KPIs for Shopify Brands
To give you a 360-degree view of your support operations, here’s a breakdown of the must-have metrics I recommend for any e-commerce brand. Each one answers a different, but equally vital, question about your performance.
| Metric (KPI) | What It Measures | Why It's Important for Shopify Brands |
|---|---|---|
| Customer Satisfaction (CSAT) | The immediate happiness of a customer after a single support interaction. | It’s your real-time pulse check on agent performance and the quality of specific conversations. Perfect for spotting coaching opportunities. |
| Net Promoter Score (NPS) | A customer's overall loyalty and willingness to recommend your brand to others. | This goes beyond one ticket; it measures how your support impacts long-term brand perception and word-of-mouth growth. |
| First Response Time (FRT) | The time it takes for an agent to send the first reply to a customer's inquiry. | Speed is critical in e-commerce. A slow first response can mean a lost sale or a frustrated customer who goes to a competitor. |
| First Contact Resolution (FCR) | Whether a customer's issue was solved in a single interaction, with no follow-up needed. | A high FCR means your team is knowledgeable and your processes are smooth. It's a huge driver of both customer satisfaction and team efficiency. |
| Resolution Time | The total time from when a ticket is created to when it’s fully resolved. | This measures the entire customer journey for a single issue. Long resolution times can point to complex problems or internal bottlenecks. |
| Ticket Volume | The total number of incoming support requests over a specific period. | Essential for staffing and resource planning. Sudden spikes can signal problems with a new product, a marketing campaign, or a site issue. |
| Ticket Escalation Rate | The percentage of tickets that need to be passed to a senior agent or another department. | A high escalation rate might mean your frontline agents need more training or better access to information to solve problems themselves. |
| Customer Support ROI | The revenue generated from support interactions versus the cost of running the support team. | This helps you prove that customer service isn't just a cost center—it's a revenue driver that boosts customer lifetime value. |
This table gives you a powerful starting scorecard. By tracking these metrics, you’ll gain a clear, comprehensive understanding of where your customer service excels and where you have opportunities to improve.
Now, let's dig a little deeper into a few of the most important ones.
Customer Satisfaction (CSAT)
This is your classic "How satisfied were you with our service today?" metric, usually asked on a simple 1-5 scale right after a chat or email conversation ends. CSAT is your most direct feedback loop on the quality of a specific support interaction and is invaluable for pinpointing trends in agent performance.
Net Promoter Score (NPS)
NPS takes a broader view by asking, "On a scale of 0-10, how likely are you to recommend our brand to a friend or colleague?" This isn't about one support ticket; it measures overall brand loyalty. A strong NPS score shows that your customer service is actively contributing to word-of-mouth growth and building long-lasting customer relationships.
First Response Time (FRT)
In the world of e-commerce, speed sells. FRT measures how long a customer has to wait for that initial reply. Think about it: every email or chat could be a pre-sale question that makes or breaks a purchase. With 39% of customers ditching a brand due to slow responses, this metric is absolutely non-negotiable.
First Contact Resolution (FCR)
Did your team solve the customer's problem on the very first try? That’s what FCR measures. A high FCR rate is a fantastic sign of an efficient, well-trained team and streamlined internal processes. It’s also a cornerstone of good customer service quality assurance. If your FCR is low, it’s often a red flag that your agents need better training or easier access to information.
Setting Up Your Data Collection and Tools
Alright, you've picked your metrics. Now comes the practical part: building a system to actually gather the data. The goal here is to automate as much as possible. Let’s be real—manual tracking is a recipe for headaches and inaccurate numbers. You need a data foundation you can trust.
The good news? Most of the tools you’re already using are probably sitting on a goldmine of data. Your helpdesk—whether it's Gorgias, Zendesk, or another favorite—is the heart of your operational metrics. It's already logging timestamps for every ticket creation, every response, and every resolution.
That means metrics like First Response Time (FRT) and Average Resolution Time are often just a pre-built report away. The data is there; you just need to know where to look.
Automating Feedback Collection
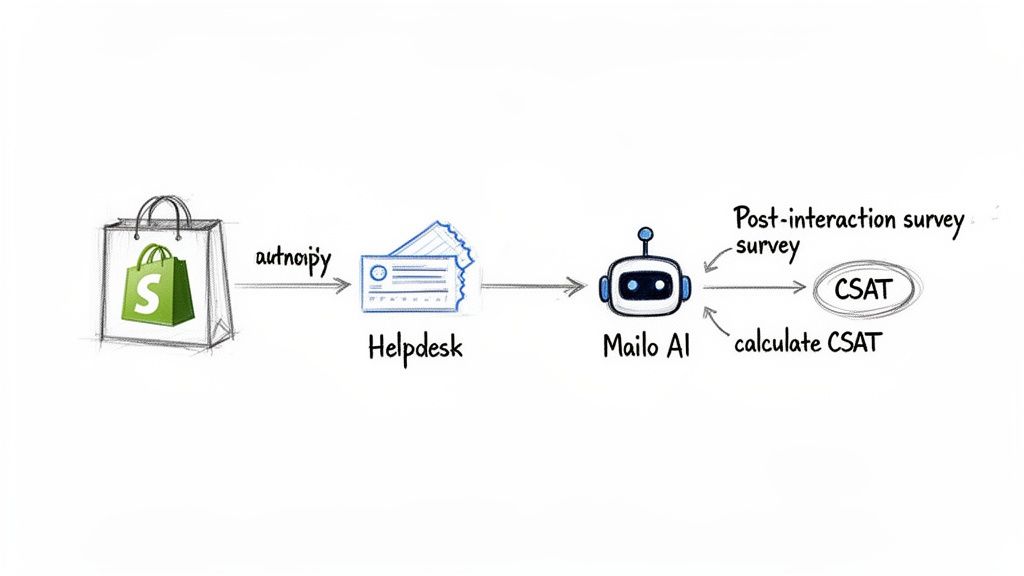
When it comes to quality metrics like CSAT and NPS, automation isn't just nice to have; it's essential. Can you imagine manually sending a survey after every single support ticket? It’s simply not going to happen for a growing Shopify brand.
Instead, you need to set up automated triggers. Most modern helpdesks let you create a simple rule: when a ticket is marked "resolved," automatically send a one-question CSAT survey. This tiny workflow is a game-changer. It catches customers while the experience is still fresh, which seriously boosts your response rates.
Key Takeaway: Your data collection should be invisible. Your team needs to focus on helping customers, not on remembering to send surveys or log their response times.
Calculating Your Core Metrics
While your tools will do most of the heavy lifting, it’s smart to understand the math behind your KPIs. Knowing the formulas helps you spot weird anomalies and have much more productive conversations with your team about what the numbers actually mean.
Here’s a quick rundown of the basic formulas for the big ones:
-
Customer Satisfaction (CSAT):
(Number of 'satisfied' responses / Total number of responses) x 100
*For example, if you get 80 happy responses out of 100 total surveys, your CSAT score is a solid 80%.* -
First Contact Resolution (FCR):
(Number of issues resolved in one contact / Total number of issues) x 100
*If your team nails 150 out of 200 tickets on the first try, your FCR rate is 75%.* -
Net Promoter Score (NPS):
% of Promoters (scores 9-10) - % of Detractors (scores 0-6)
This formula gives you a score that can range anywhere from -100 to +100.
These are the calculations that form the bedrock of your quality and efficiency measurement.
Integrating Your Tech Stack
To get the full story, your data sources need to talk to each other. The first, non-negotiable step is integrating your helpdesk with your Shopify store. This syncs customer order history and other details right into your support platform, giving agents the context they need to solve problems without a ton of back-and-forth.
But you can go deeper. Connecting your support tools to broader business analytics platforms is where you start seeing the bigger picture. For any Shopify brand serious about data, properly setting up GA4 for Shopify is a must. It helps you connect the dots between a great support experience and a customer's future purchases.
And of course, using platforms with powerful built-in analytics, like modern AI customer support software, can give you a unified view from day one. Mailo AI, for example, doesn't just automate responses; it tracks the direct impact on metrics like response times and ticket volume, showing you a clear ROI without you having to stitch together a dozen different reports.
Building a Customer Service Dashboard That Tells a Story
Raw data is just a pile of numbers. A truly great dashboard turns that noise into a story, giving you a clear, at-a-glance picture of your customer service performance. This isn't about cramming every possible chart onto one screen; it’s about getting the right information to the right people, exactly when they need it.

The secret is tailoring the view to the audience. Your frontline support agents don't need a deep dive into the quarterly ROI of your helpdesk, and your founder doesn’t need to see who's assigned to which ticket. A good dashboard gets straight to the point, communicating performance in a way that’s immediately relevant to each person's role.
Tailoring Dashboards for Different Roles
A smart way to approach this is by creating different views—daily, weekly, and monthly—that match up with different responsibilities. This ensures everyone, from your newest agent to the C-suite, gets actionable insights without feeling buried in data.
Here's how I typically see this broken down in successful DTC brands:
-
For the Support Manager (Daily/Weekly View): This is your command center. It's all about the operational health of the team right now. You need a live pulse on workloads and performance.
- What to track: Agent-specific First Response Times (FRT), individual CSAT scores, the current ticket backlog, and escalation rates.
- The goal: Spot coaching opportunities on the fly, manage daily workflow, and quickly see who’s crushing it and who might need a hand.
-
For the Founder or CX Lead (Weekly/Monthly View): This dashboard takes a step back. It’s more strategic, tying support performance directly to bigger business goals.
- What to track: Big-picture trends in CSAT and NPS, total ticket volume broken down by category (like shipping issues vs. product defects), and the ROI from any automation you've implemented.
- The goal: Uncover customer friction points, make smarter decisions about products or policies, and justify new investments in your support stack.
A dashboard should answer questions, not just display numbers. For a manager, it answers, "Is my team set up for success today?" For a founder, it answers, "Is our support strengthening our brand and bottom line?"
This kind of structure turns your data from a simple report card into a powerful strategic tool that informs both day-to-day tactics and long-term vision.
Establishing a Reporting Cadence
Let's be honest: a perfect dashboard is useless if nobody looks at it. That's why setting up a consistent reporting cadence is just as crucial as building the dashboard in the first place. You need to weave metric reviews into the fabric of your team's routine, making it a habit instead of an emergency drill when things go south.
A simple, effective rhythm might look something like this:
- Daily Check-in: A quick, 5-minute scan of the operational dashboard by the support manager. This is for catching immediate fires or clearing out backlogs before they pile up.
- Weekly Team Huddle: A 30-minute meeting to go over the past week's numbers. It’s a chance to celebrate wins (like a killer FCR rate or glowing CSAT comments) and dissect any sticky, recurring issues you’re seeing in tickets.
- Monthly Strategic Review: A dedicated meeting with leadership to zoom out and look at longer-term trends. Are we seeing more complaints about a specific shipping carrier? Did that new automation tool actually bring down our First Response Time?
This cadence transforms reporting from a reactive chore into a proactive, strategic habit. It creates a regular space for your team to find patterns, share what they’re learning, and consistently get better at serving your customers.
Turning Your Metrics into Action and Automation
Collecting data is one thing; knowing what to do with it is another game entirely. The real magic happens when you turn those numbers into smart, strategic actions that actually move the needle for your business. Your customer service metrics aren't just a report card—they're a roadmap telling you exactly where to focus.
Think about it. A sudden spike in “Where is my order?” tickets isn’t a signal to just hire more agents. It’s a bright, flashing sign that your shipping notifications or post-purchase emails aren't doing their job. That data gives you the power to fix the root cause, which prevents those tickets from ever being created in the first place.
Or what about consistently slow First Response Times (FRT)? That’s not just a number on a dashboard. It's a massive point of friction for someone who's ready to buy. When a potential customer has to wait hours for a simple question about sizing, you're practically inviting them to shop elsewhere. This metric is your cue to bring in smart automation.
Using Automation as a Strategic Lever
This is where modern tools really shine. Don't think of automation as a way to replace your team. See it as a force multiplier that frees up your best people to handle the complex, high-value conversations that build real loyalty.
A tool like Mailo AI, for example, can instantly resolve a huge chunk of your most common, repetitive questions.
- Order Status Questions: It integrates directly with Shopify to provide instant tracking info.
- Product FAQs: It can deliver accurate answers about sizing, materials, or compatibility 24/7.
- Return Policy Inquiries: It can explain your policy and even kick off the return process without delay.
By taking care of these predictable inquiries, the AI immediately slashes your response times and shrinks your ticket backlog. This gives your human agents the breathing room they need to tackle the nuanced issues that require a genuine human touch. The result is a faster, more efficient support experience for everyone involved.
By automating the predictable, you empower your team to excel at the exceptional. This isn't just about cutting costs; it's about elevating the quality of your human interactions and focusing your resources where they matter most.
Proving the ROI of Your Efforts
The final piece of the puzzle is closing the loop and measuring the impact of your changes. When you implement a tool like Mailo AI, your dashboard should tell a clear story. You should be able to see a direct decrease in ticket volume for common questions and a measurable improvement in your overall FRT.
Even better, you can calculate a rock-solid return on investment. The analytics will show you precisely how many tickets were deflected and how many agent hours were saved. You can then translate those hours directly into payroll savings. Suddenly, your support metrics transform from abstract KPIs into a powerful business case, proving that investing in a better customer experience is one of the smartest financial decisions a brand can make.
Got Questions? We've Got Answers
Even with the best plan, digging into customer service analytics for the first time can feel a little daunting. That's normal. Let's tackle some of the most common questions we hear from Shopify owners who are just starting to get serious about measuring their support performance.
What Are the First Three Metrics a Small Shopify Store Should Track?
If you're just starting out, the goal is to get the most bang for your buck without drowning in data. You want simplicity and impact.
I always tell smaller stores to start with these three:
- First Response Time (FRT): This is all about speed. A quick response can be the difference between a sale and a lost customer. You need to know you're getting back to people before they move on.
- Customer Satisfaction (CSAT): This gives you a direct, unfiltered look at how happy your customers are with the help they received. It’s the ultimate measure of quality.
- Ticket Volume by Category: Don't just count tickets; understand them. Are most questions about shipping? Returns? Product sizing? This tells you exactly where the friction is in your customer experience.
Together, these three metrics give you a solid, well-rounded view of your support's speed, quality, and the core problems your customers face. It's a powerful starting point that won't overwhelm you.
How Often Should I Be Looking at My Customer Service Metrics?
There's no single right answer here—it really depends on what you're measuring. The best approach is a tiered one, so you're staying on top of things without living in a spreadsheet.
Think of it like this: check your operational metrics—like First Response Time and any ticket backlogs—daily. These are the immediate, day-to-day numbers that keep the engine running smoothly.
For quality metrics like CSAT and NPS, a weekly or bi-weekly check-in is perfect. This gives you enough data to spot real trends in how customers feel without overreacting to a single bad day. Then, save the big strategic stuff, like the ROI of your support software, for a monthly or quarterly review to guide your long-term planning.
Can I Do This Without Shelling Out for Expensive Software?
You absolutely can. While dedicated platforms like Gorgias or Zendesk make life a lot easier, you can get started with tools you probably already use.
It's entirely possible to send out a CSAT survey using a simple Google Form after you close a conversation. You can also track response times and categorize your support tickets in a shared Google Sheet or an Airtable base.
The most important thing is to just start and be consistent. Eventually, the manual work will become a major headache. That’s your sign. When tracking this stuff manually feels like a full-time job, you'll know it's the right time to invest in a tool that can automate it all for you.
Ready to turn your customer service data into a growth engine? Mailo AI integrates with Shopify to automate responses, analyze ticket trends, and provide the clear analytics you need to improve customer satisfaction and reduce support costs. Start your free trial today.