

Customer retention metrics are the vital signs of your business. They're the numbers that tell you how good you are at keeping customers coming back after their first purchase. Forget surface-level data like website traffic for a moment. These metrics reveal the real, long-term health and profitability of your e-commerce store.
Think of them as the true pulse of your brand's relationship with its customers.
Why Retention Metrics Are Your Store's Growth Engine
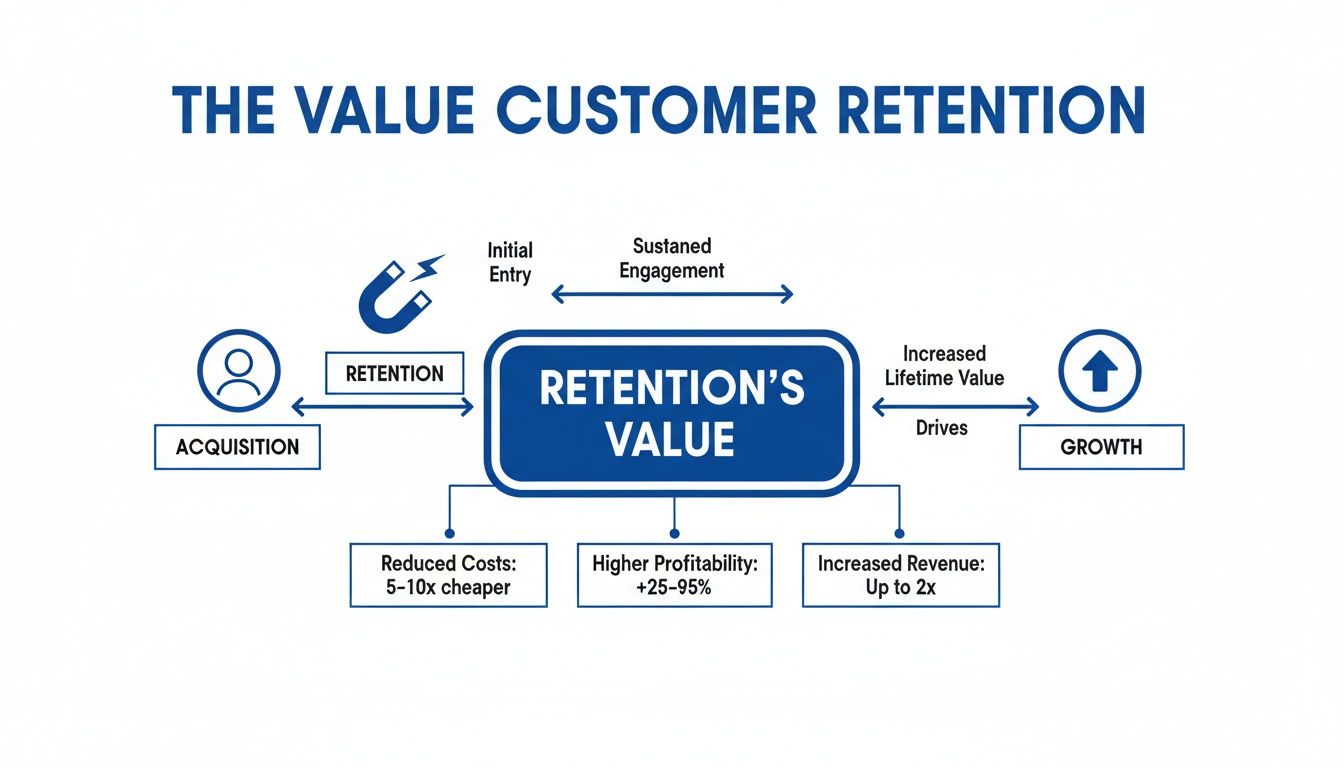
So many Shopify merchants get caught in the acquisition trap. They pour their entire budget into flashy ads to attract new eyeballs, all while their hard-won customers quietly slip out the back door. It feels busy and productive, but this hamster wheel of "acquire-and-lose" often leads to stagnant profits and a business that can't scale.
The real engine for sustainable growth isn't just about getting new customers; it’s about delighting and keeping the ones you already have.
Imagine your business is a bucket you're trying to fill with revenue. Your marketing campaigns are the hose, constantly pouring water in. But if that bucket is full of holes—customers leaving and never returning—you’ll work twice as hard just to stay level. You'll never actually fill it. Customer retention metrics are how you find and patch those holes, one by one.
The Financial Power of Keeping Customers
Focusing on retention isn't just a nice idea; it's one of the most direct paths to a healthier bottom line. Even tiny improvements here can create a massive impact on your profits.
A landmark study by Bain & Company revealed that a mere 5% increase in customer retention can boost profits by up to 100%. That’s not a typo. For e-commerce stores, this plays out every day, with repeat customers consistently spending about 67% more than first-time buyers.
This is why getting a handle on these numbers is non-negotiable. It reframes your entire approach to customer support, turning it from a cost center into a powerful profit driver. When you track how your support team impacts retention, you draw a straight line from great service to more revenue.
By shifting focus from the "cost to serve" to the "value of retaining," brands unlock sustainable growth. Every positive interaction becomes an investment in a customer's lifetime value, not just a ticket to be closed.
Beyond Vanity Numbers
Metrics like website sessions and page views are easy to track, but they don't tell you if your business is actually healthy. They're often just noise. The real story is found in loyalty and repeat business.
This is where customer retention metrics cut through the fog and help you answer the questions that really matter:
- Are my customers happy enough to come back and buy again?
- How much is a loyal customer actually worth to my business over their entire relationship with us?
- Which of my marketing channels are bringing in customers who stick around, and which ones attract one-and-done buyers?
Answering these questions gives you the power to make much smarter decisions about where to invest your time and money. You can pinpoint which experiences need improvement and use tools like Mailo AI to automate and elevate the interactions that make customers want to stay. For a deeper dive into related concepts, our guide on customer engagement metrics is a great next step.
The 7 Core Retention Metrics Every Shopify Store Must Track
Forget staring at a confusing spreadsheet, trying to figure out if your business is actually growing. Measuring customer retention is really about listening. Your customers are telling you a story with every click, purchase, and visit, and these metrics are how you translate that story into action.
Think of them as the dashboard for your business's health. They go way beyond simple sales figures to show you the real momentum you're building. When you get a handle on these numbers, you can see exactly what's working with your customer experience and, more importantly, what isn’t.
Ultimately, keeping the customers you already have is the most powerful and cost-effective way to grow. It’s the engine that drives sustainable profit.
This journey from a first-time buyer to a long-term fan is built on retention. It's the bridge that turns a single sale into lasting loyalty.
Essential Customer Retention Metrics at a Glance
Before we dive deep, here’s a quick overview of the core metrics we’ll be covering. Think of this as your cheat sheet for understanding the health of your customer relationships.
| Metric | What It Measures | Simple Formula | Key Question It Answers |
|---|---|---|---|
| Retention Rate (CRR) | The percentage of customers who stay with you over time. | [(End Customers - New Customers) / Start Customers] x 100 | Are my customers sticking around? |
| Churn Rate | The percentage of customers you lose over a period. | (Lost Customers / Start Customers) x 100 | How many customers am I losing? |
| Repeat Purchase Rate | The percentage of customers who have bought more than once. | (Customers with >1 Purchase / Total Customers) x 100 | Do customers like our products enough to come back? |
| Purchase Frequency | The average number of times a customer buys from you. | Total Orders / Unique Customers | How often do my loyal customers buy? |
| Average Order Value (AOV) | The average amount spent per order. | Total Revenue / Total Orders | How much do customers typically spend at once? |
| Customer Lifetime Value (CLV) | The total revenue a customer is projected to generate. | AOV x Purchase Frequency x Customer Lifespan | What is the total long-term value of a single customer? |
| Net Revenue Retention (NRR) | Revenue growth from existing customers (including upsells and churn). | [(Start MRR + Expansion - Churn) / Start MRR] x 100 | Are my existing customers spending more over time? |
This table gives you the essentials, but the real power comes from understanding the story behind each number. Let’s break them down one by one.
1. Customer Retention Rate (CRR)
This is the big one. Your Customer Retention Rate answers the most fundamental question for any business: "Are people actually sticking with us?" It shows you the percentage of customers who remained active from the beginning of a period to the end. A high CRR is the ultimate sign of a healthy, trusted brand.
The Formula:
CRR = [ (Customers at End of Period - New Customers Acquired) / Customers at Start of Period ] x 100
Shopify Example:
Let's say you started the quarter with 1,000 customers. At the end of the quarter, your books show 1,200 customers, but 300 of those were brand new.
[ (1,200 - 300) / 1,000 ] x 100 = 90% CRR. That means 90% of your original customers stayed.
2. Customer Churn Rate
If retention is about who stays, churn is about who leaves. Think of your business as a bucket; churn is the leak. Your Churn Rate measures the percentage of customers who stop buying from you over a specific time. Knowing this number is the first step to figuring out why they're leaving and how to patch the holes.
The Formula:
Churn Rate = ( Customers Lost During Period / Customers at Start of Period ) x 100
Shopify Example:
You began the month with 5,000 customers. Over the next 30 days, 200 of them either canceled their subscription or simply didn't come back to buy again.
( 200 / 5,000 ) x 100 = 4% Churn Rate for the month.
A high churn rate is a smoke signal. It often points to a problem with product satisfaction, shipping issues, or a clunky post-purchase experience. It’s a number that demands you dig deeper.
3. Repeat Purchase Rate
This metric cuts right to the chase: are people buying more than once? Your Repeat Purchase Rate tells you what percentage of your total customer base has made at least a second purchase. It's a direct reflection of how much people enjoy your products and trust your store enough to return.
The Formula:
Repeat Purchase Rate = ( Number of Customers with >1 Purchase / Total Number of Customers ) x 100
Shopify Example:
In the past year, 4,000 different people bought something from your store. Out of that group, 1,200 came back to place another order.
( 1,200 / 4,000 ) x 100 = 30% Repeat Purchase Rate.
To learn more about these key performance indicators and how they connect, check out our comprehensive guide to customer retention metrics.
4. Purchase Frequency
While the Repeat Purchase Rate tells you if customers come back, Purchase Frequency tells you how often they do. This metric calculates the average number of orders a single customer places in a given period. It's fantastic for understanding your customers' buying cycles and spotting your most loyal shoppers.
The Formula:
Purchase Frequency = Total Number of Orders / Total Number of Unique Customers
Shopify Example:
Your store fulfilled 10,000 orders last year, placed by 2,500 unique customers.
10,000 / 2,500 = 4. This means your average customer places four orders per year.
5. Average Order Value (AOV)
Average Order Value (AOV) measures how much customers spend on a typical order. While it's not a pure retention metric by itself, it's a vital piece of the profitability puzzle. Getting existing customers to spend a little bit more each time they check out is one of the fastest ways to grow revenue without needing more traffic.
The Formula:
AOV = Total Revenue / Total Number of Orders
Shopify Example:
Last quarter, your store brought in $500,000 in revenue from 5,000 individual orders.
$500,000 / 5,000 = $100 AOV.
6. Customer Lifetime Value (CLV)
This is the holy grail. Customer Lifetime Value (CLV) estimates the total amount of money a single customer will spend at your store over their entire relationship with your brand. It pulls together AOV and Purchase Frequency to give you a true sense of what a customer is worth. A rising CLV means you're not just making sales; you're building valuable, long-term relationships.
A Simple Formula:
CLV = Average Order Value x Purchase Frequency x Average Customer Lifespan
Shopify Example:
Your AOV is $100, and your average customer makes 4 purchases a year. Based on your data, you estimate the average customer stays loyal for about 3 years.
$100 (AOV) x 4 (Purchases/Year) x 3 (Years) = $1,200 CLV.
7. Net Revenue Retention (NRR)
Okay, this one is a bit more advanced but incredibly powerful, especially if you sell subscriptions. Net Revenue Retention (NRR) tracks the change in recurring revenue from your existing customers. It includes revenue from upsells and cross-sells but also subtracts revenue lost from churn or downgrades.
An NRR over 100% is a huge win. It means your existing customers are spending more with you over time, creating growth from within.
The Formula:
NRR = [ (Starting MRR + Expansion Revenue - Churn Revenue) / Starting MRR ] x 100
Shopify Example:
You started the month with $50,000 in recurring revenue (MRR). During the month, you generated an extra $10,000 from existing customers upgrading or adding on to their plans. However, you lost $5,000 from customers who churned.
[ ($50,000 + $10,000 - $5,000) / $50,000 ] x 100 = 110% NRR. You grew revenue by 10% without a single new customer
How to Find and Visualize Your Retention Data
Knowing your customer retention metrics is one thing, but those numbers are just abstract figures until you can see them. They're pretty useless if they're just sitting in a spreadsheet somewhere. To actually make decisions, you need to know exactly where to find the raw data and, more importantly, how to bring it to life. Think of your data as ingredients in a pantry; it's time to start cooking.
For anyone running a Shopify store, your starting point is right there in the dashboard. Many of the most important metrics are already waiting for you in Shopify Analytics, so you can get a quick pulse on your business without needing to export anything.
Visualizing your data like this helps you connect the dots, showing how different numbers all feed into your core retention strategy.
Finding Foundational Metrics in Shopify
Don't underestimate your Shopify admin panel—it's a goldmine. It gives you a surprisingly clear window into customer behavior without forcing you to become a data scientist overnight.
Here’s a quick guide on where to look for the core metrics we’ve been talking about:
- Repeat Purchase Rate: Head over to Analytics > Reports. You'll find a report called "Customers returning rate." This tells you exactly what percentage of your customers have come back for a second purchase. It's a direct signal of how happy people are with their first order.
- Average Order Value (AOV): In that same Reports section, the "Sales over time" report includes your AOV. You can easily adjust the date range to see how it fluctuates with different seasons or marketing campaigns.
- Sales by Customer: This report is your VIP list. It shows you who your most valuable customers are, giving you a clear idea of who is driving your repeat business.
Once you’ve pulled these numbers, the next step is putting them to work. A great starting point is learning how to calculate your customer retention rate with these very figures.
Moving Beyond Basic Analytics
Shopify's built-in reports are fantastic for a quick, high-level look. But to get the real, game-changing insights, you’ll need to dig a little deeper with more specialized tools.
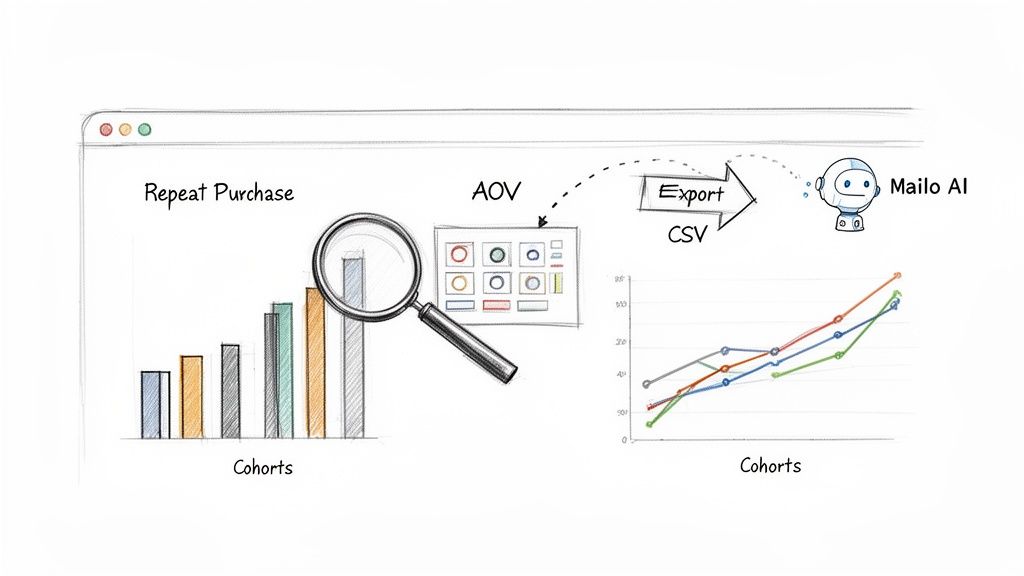
Metrics like Customer Lifetime Value (CLV) and detailed cohort analyses usually require dedicated apps from the Shopify App Store or exporting your data to something like Google Sheets or a full-blown business intelligence (BI) tool. These tools let you slice and dice your data in powerful ways, like segmenting customers by where they came from, what they bought first, or which discount code they used.
This is how you start answering the really juicy questions, like, "Do customers we acquired through Instagram ads have a higher CLV than those who came from our email list?"
Your data tells a story about your customer's journey. Basic analytics give you the chapter titles, but advanced tools let you read the actual pages, revealing the plot twists and character motivations that drive retention.
Connecting Support Performance to Retention Outcomes
The real breakthrough happens when you connect your sales data with your customer support performance. This is where you uncover the hidden drivers of loyalty.
Integrating your Shopify store with a platform like Mailo AI bridges this critical gap. It transforms abstract support metrics—like response times or satisfaction scores—into tangible retention insights. For instance, Mailo’s dashboard can visualize leading indicators of churn that Shopify Analytics simply can't see on its own. This makes it incredibly easy to spot worrying trends and step in before a customer walks away for good.
If you want a full rundown of what support metrics to track, check out our guide on how to measure customer service.
By pulling this data together and visualizing it, you can finally get clear answers to critical business questions:
- Does a faster response time actually lead to a higher repeat purchase rate?
- Do customers who give us great satisfaction scores end up having a better CLV?
- What are the most common support tickets submitted by customers who eventually churn?
When you connect these dots, the value of exceptional customer support becomes undeniable. You're no longer just resolving tickets; you're actively shaping customer loyalty and protecting your bottom line.
Interpreting Your Metrics And Setting Realistic Goals
So, you've crunched the numbers. Your dashboard is lit up with your churn rate, repeat purchase stats, and a dozen other metrics. Now what? Raw data is just noise until you give it context. The real magic happens when you learn to read between the lines and set goals that actually make sense for your store.
The first question I always hear from merchants is, "What's a 'good' customer retention rate?" And the honest answer is... it depends. There’s no universal magic number. What looks like a fantastic retention rate for one business could be a major red flag for another.
Your goals need to be rooted in the reality of your business. Things like your product type, business model, and the industry you operate in have a massive impact on what you can realistically expect.
Why Your Industry Defines Your Benchmarks
Let's get practical. Imagine two Shopify stores. One sells gourmet coffee beans on a subscription model, and the other sells high-end, custom-made furniture.
The coffee brand’s entire business is built on frequent, repeat purchases. A high repeat purchase rate is their lifeblood. For them, an annual retention rate of 60% might feel alarmingly low, signaling a problem with their product or customer experience.
Now, think about the furniture store. A customer might only buy a new sofa every five or ten years. A low repeat purchase rate is completely normal and expected. Instead of chasing monthly repeat buys, their focus should be on maximizing the Average Order Value (AOV) of that one big purchase and generating powerful word-of-mouth referrals.
See? Context is everything. It’s critical to compare your store to the right market. For instance, data across different sectors shows that media and professional services can see average retention rates around 84%. Meanwhile, retail and e-commerce often hover in the low- to mid-60s for annual retention. These numbers highlight just how wide the range is, which is why a one-size-fits-all goal will only set you up for frustration. You can dig deeper into these industry and regional retention benchmarks to get a feel for your specific sector.
Using Cohort Analysis To Uncover Hidden Trends
If you want to move beyond broad averages and find insights you can actually act on, you need to embrace cohort analysis. Think of it as creating little focus groups from your customer data.
A cohort is just a group of customers who share a common trait, most often the date they made their first purchase. For example, you could create a cohort for:
- Every customer you acquired during your Black Friday sale.
- Everyone who made their first purchase in January.
- All the first-time buyers who came from a specific Instagram ad campaign.
When you track these groups separately over time, you start to see powerful trends that a single, store-wide retention rate would completely hide.
Cohort analysis helps you answer specific, strategic questions. It moves you from asking, "What is my retention rate?" to "Which of my marketing efforts bring in the most loyal, high-value customers?"
This technique lets you compare the long-term value of different customer segments. You might find out that your Black Friday shoppers have a massive initial churn rate, but customers acquired through your email newsletter stick around for years. That insight is pure gold. It tells you exactly where to invest more of your marketing budget and which acquisition channels need a stronger post-purchase experience to build loyalty.
Suddenly, your retention metrics aren't just a report card—they're a roadmap for smarter growth.
Actionable Strategies To Improve Your Retention Metrics
Think of your customer retention metrics as a report card for your business. It shows you exactly where you're acing it and where you need to put in some extra work. Now, it's time to turn those insights into action. This section is your playbook for actually moving the needle on those numbers, transforming data into real, tangible growth.
Instead of just throwing generic advice your way, we'll connect specific strategies to the metrics they directly impact. Whether you're trying to cut down your churn rate or give your customer lifetime value a serious boost, these are tactics you can put into play right away.
Strategies to Boost Repeat Purchase Rate
Your Repeat Purchase Rate is a direct reflection of customer satisfaction. When this number is high, it means people love what you’re selling and trust your brand enough to come back for more. The whole goal here is to make that second purchase an absolute no-brainer.
Here are a few proven ways to do just that:
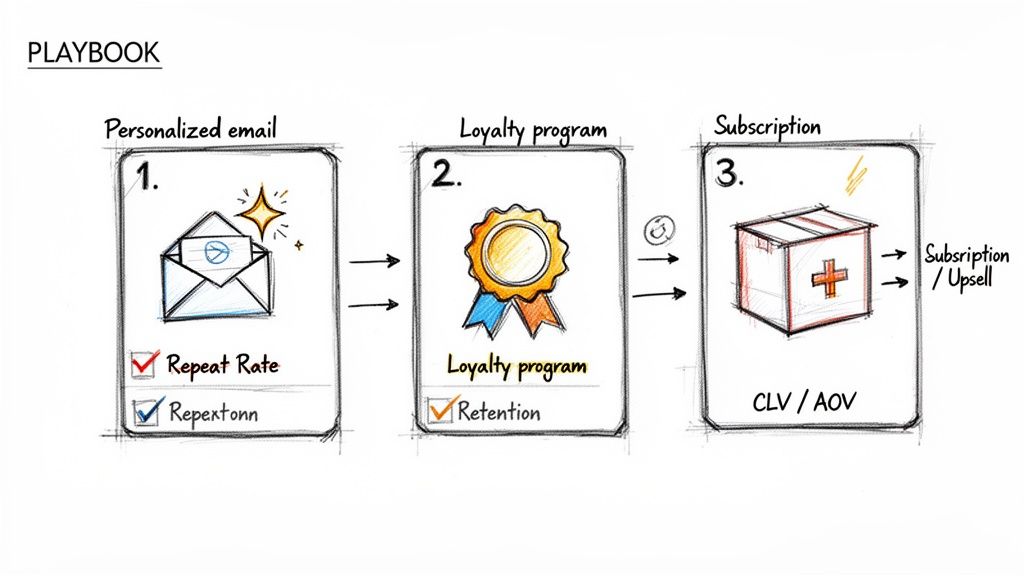
- Launch a Points-Based Loyalty Program: Reward customers for every dollar they spend. These points can then be cashed in for discounts, freebies, or exclusive perks. A well-designed program makes every purchase feel like an investment in a future reward, and with 59% of consumers saying loyalty programs make them stick around, it's a powerful tool.
- Implement Personalized Post-Purchase Campaigns: The conversation shouldn't stop at the "thank you" page. Use email automation to send relevant follow-ups based on what someone bought. Did they buy a specific coffee blend? A few weeks later, send a friendly restock reminder along with a suggestion for a new blend they might love.
- Offer "Come Back" Incentives: For first-time buyers who haven't returned, a small, time-sensitive discount can be the perfect nudge. A simple, "We miss you! Here's 15% off your next order" email can easily reactivate a customer who might have just forgotten about your store.
Mailo AI In Action: Boosting Repeat Purchases
Imagine a customer just completed their first purchase. Instead of a generic confirmation email, Mailo AI can trigger a personalized sequence. This could include a sincere thank you, tips on getting the most out of their new product, and a sneak peek at related items. This kind of thoughtful engagement turns a simple transaction into the beginning of a real relationship, making that second purchase feel completely natural.
Tactics to Increase Customer Lifetime Value (CLV)
Increasing CLV is all about maximizing the total revenue you get from each customer over their entire journey with your brand. It’s a long game that involves encouraging them to spend more, more often, and for a longer time.
Consider these high-impact strategies:
- Introduce Subscription Models: This is a game-changer for consumable products like skincare, supplements, or coffee. Subscriptions automate repeat purchases, lock in future revenue, and offer incredible convenience for your customers.
- Master Upselling and Cross-Selling: During checkout or in post-purchase emails, you can intelligently recommend complementary products or premium versions. If a customer is buying a camera, suggest a lens kit (a cross-sell) or a more advanced model with better features (an upsell).
- Create Product Bundles: Group related items together at a slightly discounted price. This not only increases the Average Order Value (AOV) but also introduces customers to more of your product catalog, paving the way for future individual purchases.
Mailo AI In Action: Increasing CLV
Let's say a customer emails asking about a specific product. Mailo AI’s instant replies can do more than just answer the question. You can configure it to intelligently suggest a product bundle that includes their item of interest, pointing out the extra value and savings. This simple step turns a basic product inquiry into a golden opportunity to increase AOV and, by extension, long-term CLV.
How to Directly Reduce Your Churn Rate
Churn is the silent killer of growth. Cutting it down means figuring out why customers are leaving and proactively fixing those issues. More often than not, churn is a direct result of a poor customer experience, making exceptional support your number one line of defense.
The link between customer experience (CX) and retention is undeniable. Studies show that customer-obsessed companies report roughly 51% better retention than their peers. On top of that, customers with positive past experiences are willing to spend up to 140% more, showing how great service directly fuels revenue. From a support perspective, between 17–44% of customers will leave after just one bad interaction, tying metrics like response time directly to your churn rate.
Exceptional customer support is no longer a "nice-to-have"—it is one of the most direct and controllable levers you have to reduce churn. Every resolved ticket and every quick, helpful reply is an act of retention.
Improving your support experience is absolutely critical. For a full breakdown, check out our guide on how to improve the e-commerce customer experience.
Mailo AI In Action: Reducing Churn
Picture this: a customer anxiously emails, "Where is my order?" Instead of making them wait hours for a reply, Mailo AI provides an instant, empathetic response with real-time tracking information pulled directly from Shopify. That single interaction defuses frustration and turns a moment of anxiety into an experience of reassurance and trust. By resolving the most common—and stressful—inquiries in a heartbeat, Mailo AI directly prevents the negative experiences that cause customers to churn.
Your Top Customer Retention Questions, Answered
Even after you get the hang of the basic concepts, real-world questions always pop up once you start digging into your own Shopify store's data. Getting comfortable with the details of customer retention metrics is what separates guessing from making confident, profitable decisions.
This section tackles the most common questions we hear from merchants. We'll give you clear, straightforward answers to help you handle the day-to-day challenges of building a customer base that sticks around.
How Often Should I Be Looking at My Retention Metrics?
The right rhythm for tracking your metrics really depends on the metric itself and your store’s natural sales cycle. The key is to avoid checking everything, every day. If you stare at the numbers too closely, you'll end up reacting to tiny, meaningless blips instead of spotting the real trends that matter.
A balanced approach works best for most stores:
- Weekly Check-ins: Metrics like Average Order Value (AOV) and Repeat Purchase Rate are perfect for a weekly review. They give you quick feedback on how that recent sale or website tweak is performing.
- Monthly Reviews: Customer Retention Rate (CRR) and Churn Rate need a bit more time to tell a story. Looking at these monthly or quarterly helps you see significant patterns emerge from the noise.
- Quarterly Deep Dives: Customer Lifetime Value (CLV) and cohort analysis are your strategic planning tools. Reviewing them quarterly gives you a high-level view of long-term customer behavior and tells you if your overall retention strategy is actually working.
Think of it like driving a car. You glance at the speedometer constantly and the fuel gauge every trip (weekly metrics), but you only check the oil and tire pressure every so often (monthly and quarterly). Each has its own right time.
What's the Real Difference Between Retention and Loyalty?
People often use "retention" and "loyalty" as if they're the same thing, but they represent two very different—though connected—parts of the customer relationship. Nailing down this difference helps you set much sharper goals for your brand.
Customer retention is a behavior. It's the simple, measurable fact that a customer came back and bought something else. It's transactional. It answers the question, "Did they buy again?" You can easily have "retained" customers who are just shopping with you out of convenience or because you had the best price that day.
Customer loyalty is an emotion. It’s the positive feeling a customer has for your brand that causes them to come back. A loyal customer sticks with your store even when a competitor has a slightly better deal. They're the ones who tell their friends about you, forgive you for a minor shipping delay, and feel a real connection to what your brand stands for.
Retention is what they do; loyalty is why they do it. The ultimate goal is to build so much loyalty that retention becomes the natural result.
You track retention with hard numbers like Repeat Purchase Rate. You get a feel for loyalty through things like your Net Promoter Score (NPS), glowing product reviews, and how people are talking about you on social media.
I'm a Small Store. Are These Advanced Metrics Overkill?
Not at all. In fact, for a small store that's trying to grow, tracking these metrics is arguably even more important. You might not have the massive data sets of a huge corporation, but that's the point—every single customer has a much bigger impact on your bottom line.
For a small business, losing just a handful of customers to churn can put a real dent in your monthly revenue. Figuring out why those few people left is an incredibly valuable lesson you can use right away to protect your future growth.
Here’s why even the smallest Shopify stores should be tracking these numbers:
- Spotting Trends Early: Metrics like cohort analysis can flag a problem or an opportunity long before it affects your whole store. You might find that customers who came from a specific Instagram ad have a sky-high CLV, telling you exactly where to put your next marketing dollar.
- Truly Understanding Your Customers: As a small store, you have the advantage of being closer to your customers. Tracking their purchase frequency and AOV helps you learn their habits on a more personal level, which lets you communicate in a way that actually connects.
- Making Smarter Growth Decisions: These numbers give you the proof you need to invest wisely. Once you know your CLV, you can figure out a sustainable Customer Acquisition Cost (CAC), making sure you’re building a profitable business from the ground up, not just a busy one.
You don't need a fancy, expensive analytics platform to get going. A simple spreadsheet and the reports already in your Shopify dashboard are more than enough to start finding the insights that will help your small store grow into a big one.
Ready to turn your customer support from a cost center into a retention engine? Mailo AI integrates directly with Shopify to provide instant, personalized answers that delight customers and build loyalty. Start your free trial today and see how automation can fuel your growth.