

Think of customer engagement metrics as the pulse of your business. They aren't just numbers on a spreadsheet; they're the vital signs that tell you how customers are really interacting with your brand at every step.
This data is essentially the digital conversation between your brand and your customers. A healthy, flowing conversation builds loyalty, brings people back for more, and creates a stable, growing business.
Why Customer Engagement Metrics Matter for Your Shopify Store
If you feel like you're drowning in data but starving for real insights, you're not alone. It's easy for Shopify store owners to get lost in a sea of analytics, often tracking vanity metrics that look good but don't actually move the needle on growth. The trick is to focus on the numbers that signal a truly healthy relationship with your customers.
Tracking the right customer engagement metrics takes the guesswork out of your strategy. Instead of just wondering why sales are down, you can pinpoint exactly where things are going wrong. Are people ignoring your emails? Bailing on their shopping carts? Getting frustrated by slow support? Each of these problems has a specific metric that can light the way.
This guide will give you that clarity. We'll break down the most important metrics into three core areas to reveal the true health of your customer relationships:
- Customer Loyalty: Are your customers sticking around for the long haul?
- Customer Satisfaction: How happy are people with their experience?
- User Behavior: What are people actually doing on your site and with your marketing?
For example, a quick glance at a dashboard, like this one from Mailo AI, can instantly show you how your support team is performing.
This kind of visual summary immediately tells you about total conversations, how quickly issues are being resolved, and even how many hours you've saved. It’s a fast way to see how your support efforts are impacting the overall customer experience.
From Data Points to Actionable Strategy
At the end of the day, tracking numbers is pointless unless you use them to make smart decisions. The real goal is to turn this data into a clear roadmap for action.
A dip in your Repeat Purchase Rate isn't just a random statistic; it’s a bright, flashing sign that your post-purchase experience might be falling flat. A slow First Response Time tells you that real customers are waiting too long for help, which chips away at their satisfaction and can push them to your competitors.
Throughout this guide, we won't just give you the formulas and benchmarks. We’ll show you how to interpret what you're seeing and, more importantly, how tools like Mailo AI can help you directly improve these numbers. Your support team can go from being a cost center to one of your most powerful engines for growth.
Decoding Customer Loyalty and Lifetime Value
True customer loyalty isn't just a warm, fuzzy feeling. It's a tangible asset and, honestly, the holy grail of customer engagement. Think about it this way: are you just selling one-off tickets to an amusement park, or are you building a dedicated community of season pass holders? The e-commerce brands that truly thrive are the ones focused on the latter, building long-term relationships that pay off again and again.
This is exactly where loyalty-focused customer engagement metrics step in. They help you zoom out from a single transaction and see the entire story of a customer's relationship with your brand. These numbers aren't just report cards on past performance; they're powerful crystal balls for predicting your store's future health and stability.
The image below shows how loyalty is a cornerstone of engagement, working hand-in-hand with customer satisfaction and their actual buying behavior.
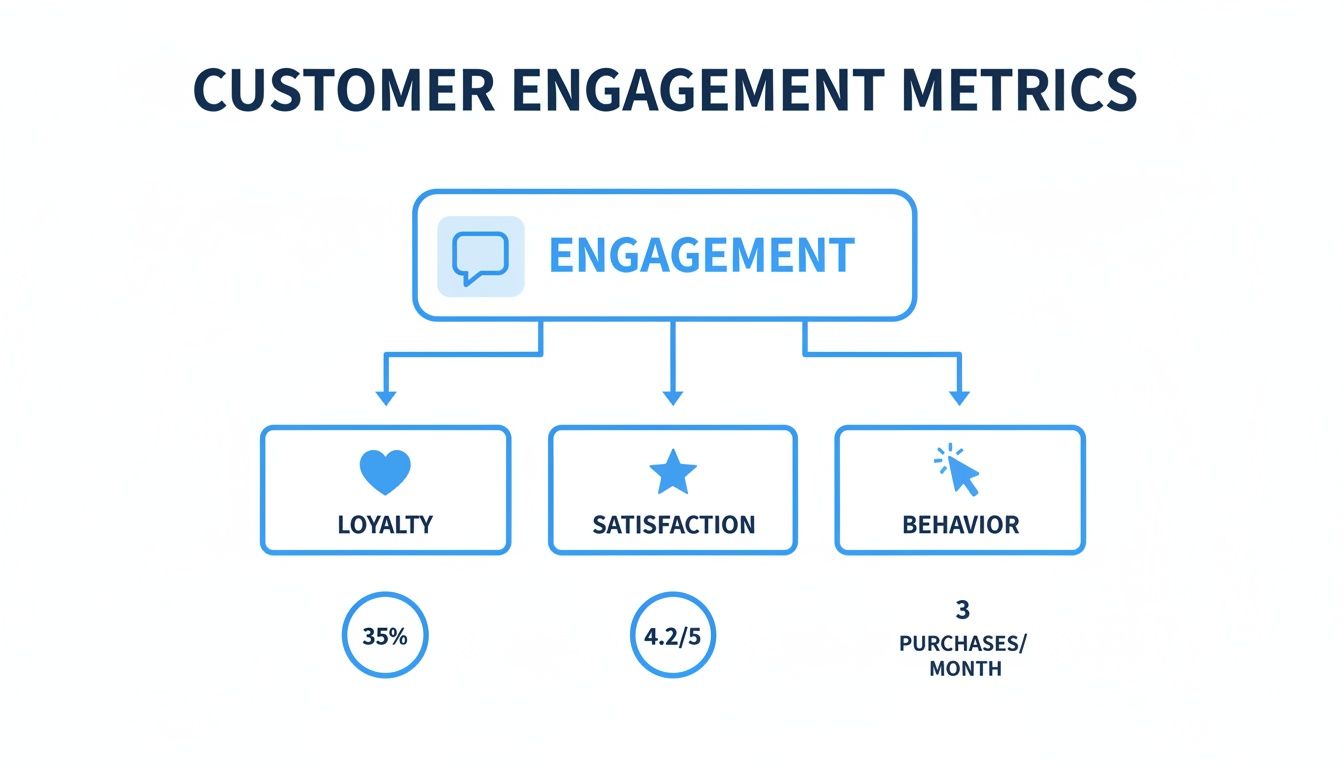
As you can see, loyalty isn't an island. It’s built on a foundation of positive experiences and consistent, meaningful interactions with your brand.
The North Star Metric: Customer Lifetime Value (CLV)
If you had to pick just one metric to obsess over, it should probably be Customer Lifetime Value (CLV). This number is a game-changer because it shifts your entire mindset from chasing short-term sales to cultivating long-term profitability.
Customer Lifetime Value (CLV) is the total revenue you can reasonably expect from a single customer throughout their entire relationship with your brand.
A strong CLV is proof that you're turning first-time buyers into loyal fans who trust your brand enough to come back. It’s the metric that justifies spending a bit more to acquire a new customer, because you have the data to prove they'll deliver value far beyond that initial purchase. While your Shopify dashboard can give you a basic calculation, the real magic happens when you start digging into the behaviors that make this number go up.
Leading Indicators of Loyalty and Churn
While CLV is your ultimate destination, two other metrics act as your real-time GPS, telling you if you're actually heading in the right direction: Repeat Purchase Rate and Customer Churn Rate.
1. Repeat Purchase Rate (RPR)
This one is simple but powerful. RPR measures the percentage of your customers who have bought from you more than once. It’s a direct reflection of how much they enjoyed the product and the overall experience. A healthy RPR is a clear sign that people liked what they got enough to come back for more.
- Why It Matters: We've all heard the stats—it can cost 5 times more to attract a new customer than to keep an existing one. A rising RPR means your retention efforts are paying off, which flows directly to your bottom line.
2. Customer Churn Rate
On the flip side of the coin is your churn rate. This metric tracks the percentage of customers who stop buying from you over a set period. It's the ultimate anti-engagement metric. A high churn rate is a massive red flag, signaling that something is broken in your customer journey, whether it's the product, the post-purchase experience, or your support.
To get a better handle on these crucial numbers, every interaction counts—especially in customer support. Slow, generic, or unhelpful support is a huge driver of churn. If a customer feels ignored, they're not coming back, no matter how great your products are. We dive much deeper into this in our guide on how to measure customer service.
To help you get started, here's a quick reference table for the most important loyalty metrics.
Key Loyalty Metrics at a Glance
| Metric Name | What It Measures | Simplified Formula | Good Benchmark |
|---|---|---|---|
| Customer Lifetime Value (CLV) | The total profit a customer will generate over time. | (Average Order Value) x (Purchase Frequency) x (Customer Lifespan) | $1,000+ |
| Repeat Purchase Rate (RPR) | The percentage of customers who buy more than once. | (Customers with >1 Purchase / Total Customers) x 100 | 20-40% |
| Customer Churn Rate | The percentage of customers lost over a period. | (Lost Customers / Total Customers at Start) x 100 | Below 5-7% monthly |
These benchmarks can vary by industry, but they provide a solid starting point for most growing e-commerce stores looking to build a sustainable business.
How Mailo AI Turns Buyers into Lifelong Fans
Improving these loyalty metrics doesn't require huge, expensive campaigns. It's all about delivering consistently excellent experiences, one customer at a time. This is where AI-powered support can make a massive difference.
Mailo AI directly impacts your CLV by strengthening the very indicators that build loyalty. It delivers instant, personalized answers to common questions 24/7, ensuring no customer is left waiting for help. That immediate, helpful interaction dramatically boosts the odds of a first-time buyer becoming a repeat customer.
Beyond that, Mailo helps you get ahead of problems. By automating proactive follow-ups and resolving issues before they escalate, it cuts down on customer frustration and lowers your churn rate. It transforms your email support from a potential bottleneck into a reliable, brand-building engine that makes customers feel seen and valued—encouraging them to stick around for the long haul.
Measuring the Heartbeat of Your Customer Experience
If loyalty metrics give you the long-term forecast for your customer relationships, then satisfaction metrics are the real-time pulse of your brand. They’re an immediate check-in on how customers feel about specific interactions, like a direct EKG for your customer experience. Did that recent purchase meet their expectations? How did that support chat go?
These immediate feedback loops are absolutely vital for e-commerce stores. We all know a single bad experience can send a customer running, but a great one can create a loyal fan. By keeping a close eye on satisfaction, you can spot problems early and lean into what's actually working.

Taking the Temperature with CSAT
The most straightforward way to measure satisfaction is with the Customer Satisfaction Score (CSAT). You've seen this a million times—it's the classic "How satisfied were you?" survey, usually on a simple 1-to-5 or 1-to-10 scale. Its real power is in its simplicity and how quickly you can get a read on a specific interaction.
CSAT is a crucial post-interaction metric that tells you how well your support team or checkout process met a customer's immediate expectations. The stakes are high; research shows that 86% of customers will happily pay more for a great customer experience. CSAT is one of the clearest ways to know if you're delivering on that promise.
CSAT Formula: (Number of Satisfied Customers / Total Survey Responses) x 100
What's a "satisfied" customer? Typically, it's anyone who gives you a 4 or 5 on a 5-point scale. The trick is to ask at the right moment—right after a support ticket is closed or a few days after an order arrives is perfect.
Gauging Brand Allegiance with NPS
While CSAT is all about a single touchpoint, Net Promoter Score (NPS) zooms out to measure a customer's overall loyalty to your brand. It asks a much bigger, more powerful question: "How likely are you to recommend our brand to a friend or colleague?" This one question slices your customer base into three distinct groups.
- Promoters (Score 9-10): These are your champions. They love what you do and will tell others about it.
- Passives (Score 7-8): They're satisfied but not thrilled. They could easily be swayed by a competitor's offer.
- Detractors (Score 0-6): These are unhappy customers who might actively damage your reputation with bad reviews.
Your NPS score is simply the percentage of Promoters minus the percentage of Detractors. Any positive score is a good start, but hitting a score above 50 is considered excellent. For a deeper look at collecting this kind of feedback, check out this fantastic guide to measuring customer experience.
Measuring Respect for Your Customer's Time
Beyond surveys, two of the most important customer engagement metrics have nothing to do with what customers say. It’s all about what you do. These metrics measure the speed and efficiency of your support team, which sends a clear message about how much you value your customers' time.
First Response Time (FRT) is the average time it takes for your team to send an initial reply to a customer. A slow FRT is a recipe for frustration; it can make a tiny issue feel like a huge headache.
Average Resolution Time (ART) measures the total time it takes to completely solve a customer's problem, from their first message to the final "all set!" A long ART leaves customers feeling stuck in limbo, waiting for an answer.
Both of these metrics have a direct impact on CSAT and NPS. When you respond quickly and fix problems efficiently, satisfaction naturally goes up.
How Mailo AI Supercharges Your Satisfaction Metrics
Trying to drive down your response and resolution times without sacrificing quality is a massive headache for growing stores. This is exactly where Mailo AI can be a game-changer for your support team and your satisfaction scores.
Mailo AI delivers instant, smart answers to common customer questions, 24/7. This immediately slashes your First Response Time from hours down to just a few seconds. Instead of getting annoyed while they wait, customers get the help they need right away, turning a moment of friction into a positive experience.
By automating the resolution of routine tickets—like "Where is my order?" or "How do I start a return?"—Mailo also drastically cuts your Average Resolution Time. This frees up your human agents to handle the more complex, sensitive issues that need a personal touch. The result isn't just a more efficient team; it's happier customers, higher CSAT scores, and more brand promoters. A better support system is a powerful way to lift the entire customer journey, as we explore in our guide on how to https://mailo.ai/blogs/customer-support-automation/how-to-improve-ecommerce-customer-experience.
How Customers Behave Tells You What They Really Think
Loyalty and satisfaction scores are great for understanding long-term sentiment, but behavioral metrics show you what customers are doing on your site and in their inbox right now. These are the real-time signals of interest and intent.
Think of it like a conversation. If someone opens your email, clicks a link, and spends time on your website, they're leaning in and listening. These actions are the critical bridge between someone being passively aware of your brand and actively considering a purchase. Tracking them shows you exactly what’s working and what’s causing people to lose interest.
Are Your Emails Being Opened or Just Deleted?
For any Shopify store, email is your direct line to your customers, whether it's a weekly newsletter or a simple order confirmation. You can learn almost everything you need to know about your email strategy by looking at two core metrics: Email Open Rate and Click-Through Rate (CTR).
Email Open Rate is simply the percentage of people who opened a specific email you sent. This metric is a direct gut check on your subject line's appeal and your brand's reputation. If your open rate is low, it’s a flashing red light that your message isn't cutting through the noise in a crowded inbox.
The Click-Through Rate (CTR) goes a step further. It measures the percentage of people who not only opened your email but also clicked on a link inside it. A high CTR is proof that your content—the offer, the story, the product you featured—was compelling enough to make someone take the next step.
A high open rate but a low click-through rate usually points to a mismatch. Your subject line wrote a check that the email's content couldn't cash.
Turning Clicks into Customers with Conversion Rate
At the end of the day, all this engagement has to lead somewhere. The Conversion Rate is the metric that connects all these behavioral dots directly to your revenue. It tracks the percentage of visitors who take a specific action you want them to, which for most e-commerce stores means making a purchase.
This is the final, most important step. A customer can open your emails, click over to your site, and browse for twenty minutes, but if they don't buy anything, the journey failed. A low conversion rate, especially when you have otherwise engaged traffic, often signals a problem with the final hurdles—things like confusing checkout steps, surprise shipping fees, or a last-minute question that goes unanswered.
Fixing this one number can completely change your business. Imagine a customer has a full cart but hesitates because they're unsure about sizing. Getting them an instant, helpful answer from a tool like Mailo AI can be the difference between an abandoned cart and a sale. By removing that last bit of friction, you directly rescue that conversion.
Are People Sticking Around on Your Site and Socials?
The path to purchase isn't the only behavior that matters. A few other metrics help paint a more complete picture of genuine customer interest.
-
Average Session Duration: How long does a visitor typically stay on your website? Longer sessions are a great sign. It means people are hooked, exploring different products, or actually reading the content you worked so hard to create.
-
Social Media Engagement: This isn't just about follower count. We're talking about the real interactions: likes, comments, shares, and saves on your posts. These actions show you're building a genuine community, not just broadcasting to a passive audience.
When you look at all these behavioral customer engagement metrics together, you can trace the entire customer journey from start to finish. You’ll see exactly where people are engaged, where they drop off, and where a small tweak—like offering faster support—can make all the difference.
Building Your Actionable Engagement Dashboard
Watching individual customer engagement metrics is a solid first step, but the real magic happens when you see them working together. Data scattered across Shopify, your email platform, and your helpdesk tells you bits and pieces of the story. To get the full picture, you need a centralized dashboard—a single source of truth that translates raw numbers into a clear narrative about the health of your business.
Think of it like a pilot's cockpit. A pilot isn’t staring at just one dial; they’re scanning altitude, speed, and fuel levels all at once to make smart decisions. Your engagement dashboard does the same job, helping you navigate the ups and downs of e-commerce by connecting the dots between different data points.
This unified view is crucial because looking at metrics in a vacuum is a classic—and costly—mistake. For example, a high Click-Through Rate on an email campaign doesn't mean much if your Conversion Rate is flatlining. A fantastic CSAT score can easily hide bigger issues if your Churn Rate is quietly creeping up month after month. Your dashboard is where you see how these different forces interact.
Organizing Your Dashboard by Review Cadence
Here’s a pro tip: not every metric needs your attention every single day. If you try to monitor everything constantly, you'll burn out from data fatigue and end up doing nothing. The smart move is to organize your dashboard by how often you need to check in, separating the numbers that require an immediate response from those that inform long-term strategy.
This approach creates a sustainable rhythm, ensuring you’re focusing on the right things at the right time.
-
Daily Pulse Checks (Operational): These are your frontline indicators, telling you about the immediate health of your customer interactions. Watching them daily helps you put out small fires before they turn into infernos. Focus on metrics like First Response Time (FRT) and Customer Satisfaction (CSAT) scores from yesterday's tickets.
-
Weekly Trends (Tactical): This is your cadence for spotting patterns in customer behavior and checking on campaign performance. It’s where you make tweaks to your marketing and sales tactics. Look at your Conversion Rate, Email Open/Click-Through Rates, and Repeat Purchase Rate (RPR).
-
Monthly Health Reports (Strategic): These are your big-picture numbers. A monthly review helps you gauge overall business health and make strategic decisions for the quarter ahead. This is where you dig into Customer Lifetime Value (CLV) and Customer Churn Rate.
Deciding on the right review cadence is key to turning data into action without getting overwhelmed. The table below offers a simple framework for how you might structure this.
| Metric Category | Key Metrics | Review Cadence | Purpose of Review |
|---|---|---|---|
| Operational Health | FRT, CSAT, Resolution Time | Daily | Catch immediate service issues and address customer friction quickly. |
| Tactical Performance | Conversion Rate, RPR, Email CTR | Weekly | Adjust marketing campaigns and identify short-term customer behavior trends. |
| Strategic Growth | CLV, Churn Rate | Monthly/Quarterly | Evaluate long-term customer loyalty and inform high-level business strategy. |
By separating your metrics this way, you create a focused routine—quick daily check-ins for operations, deeper weekly analysis for tactics, and comprehensive monthly reviews for strategy. This ensures you’re always making data-informed decisions, from the front lines to the boardroom.
Centralizing Your Data Sources
To build this dashboard, you’ll need to pull information from a few key places. Shopify Analytics is your go-to for sales data like CLV and Conversion Rate. Your email marketing tool (like Klaviyo or Mailchimp) will give you your Open and Click-Through Rates. And finally, your support platform is where you’ll find essential service metrics like FRT, Average Resolution Time, and CSAT.
To truly tell a story with this data, mastering the art of data visualization and dashboards is what brings these different sources together into one coherent picture.
A great dashboard doesn't just present data; it answers questions. At a glance, it should tell you: "How are we doing today?" and "Are we on track to meet our monthly goals?"
This is where an integrated tool like Mailo AI can be a game-changer. Its built-in analytics dashboard automatically pulls together all your critical support metrics, saving you the headache of building manual reports. Instead of juggling multiple logins and messy spreadsheets, you get a clear, real-time view of your team's performance and how it directly impacts customer happiness—all in one place. It makes it dead simple to see how faster response times lead to happier customers, turning your support data into a powerful engine for growth.
From Insights to Action with AI-Powered Support
Watching your customer engagement metrics is one thing, but the real magic happens when you use those numbers to make smart moves. A dashboard brimming with data is just a pretty picture until you use it to improve your customer experience and, of course, your bottom line.
Think of it this way: a negative trend isn't a failure, it's a signpost. A dipping CSAT score or a climbing Churn Rate is your customer base telling you exactly where the friction is. They're pointing you to the parts of their journey that need a little love.
Turning Your Dashboard into an Action Engine
This is where the loop between insight and action closes, especially with an AI tool like Mailo AI. Your dashboard tells you what's happening, and the AI gives you the how—the way to actually fix it.
Let's make this real. Say your dashboard is flashing a high First Response Time (FRT). Customers are waiting, and they're not happy about it.
Mailo AI steps in by providing instant, 24/7 answers to all the common questions, which immediately brings that FRT number way down and bumps up satisfaction.
Or maybe you spot a low Repeat Purchase Rate (RPR). This often means your post-purchase game is weak. Mailo’s integration with Shopify can trigger automated, personal follow-ups to re-engage those customers, ask for reviews, and gently nudge them toward becoming loyal fans instead of one-time buyers. It makes them feel cared for long after the checkout is complete.
By automating the routine stuff, AI does more than just speed up your support team. It shifts your entire support operation from a reactive cost center into a proactive tool for growth.
From Reactive Fixes to Proactive Growth
In the end, acting on these metrics is all about building a smoother, better experience that keeps people coming back. AI-powered support is what makes this achievable, even as you scale.
If you're curious about the nuts and bolts of setting this up, our guide on how to automate customer service is a great place to start.
It’s time to stop just watching the numbers change. With Mailo AI, you can take the insights from your dashboard and turn them into real-world improvements that build loyalty and drive serious business growth.
Frequently Asked Questions
Jumping into the world of customer engagement metrics can feel a little overwhelming. Let's tackle some of the most common questions we hear from Shopify store owners, so you can turn all that data into smart, profitable decisions.
Which Metric Is Most Important for a New Store?
When you're just starting out, zero in on Customer Satisfaction (CSAT) and First Response Time (FRT). Think of these as your two most critical leading indicators.
In the early days, every single customer interaction is a chance to build your reputation from the ground up. A high CSAT score tells you you're hitting the mark and building that crucial initial trust. At the same time, a speedy FRT shows new customers that you’re on the ball and respect their time. Get these two right, and you're laying the perfect foundation for future loyalty and great word-of-mouth.
How Can I Track Metrics Without Expensive Software?
You don't need a huge budget to get started. In fact, you can track a lot of the core metrics with tools you’re probably already using.
Your own Shopify Analytics is a goldmine for digging into Customer Lifetime Value (CLV), Repeat Purchase Rate, and Conversion Rate. For email metrics, your email marketing platform will have everything you need on Open Rates and Click-Through Rates.
For CSAT, you could even start with a simple survey tool or a personal follow-up email after a purchase. But, if you want to see the whole picture of your support performance in real-time without patching data together manually, an integrated tool like Mailo AI is a game-changer. Its analytics dashboard automatically pulls all your key support metrics into one place.
What Is a Common Mistake to Avoid When Analyzing Data?
The single biggest mistake is looking at customer engagement metrics in a vacuum. A high Email Open Rate feels great, but it’s just a vanity metric if your Click-Through Rate and Conversion Rate are flatlining. You have to connect the dots and find the story the numbers are telling you.
For instance, if you see a sudden drop in your CSAT score, don't just stop there. Does it line up with a recent spike in support tickets? Did your Average Resolution Time get slower? Seeing how these metrics influence each other helps you find the root of the problem, not just the symptom.
How Often Should I Review My Engagement Metrics?
There’s no one-size-fits-all answer here—it all depends on the metric. Trying to watch everything every day is a surefire way to get overwhelmed. A tiered approach is much more effective.
- Daily or Weekly: Keep a close eye on your operational metrics like First Response Time and CSAT. These are your pulse checks for immediate customer happiness.
- Weekly or Bi-Weekly: Look at tactical metrics like Conversion Rate and Repeat Purchase Rate. This is the right cadence to see if your marketing tweaks are working.
- Monthly or Quarterly: Dig into the big-picture, strategic metrics like CLV and Churn Rate. These numbers will help steer your long-term business strategy.
Ready to turn your support data into a growth engine? Mailo AI provides the instant, intelligent email support and automated analytics you need to boost satisfaction, build loyalty, and drive sales. Start your free trial today.