

So, what do we actually mean when we talk about "customer service measurement"? It’s simply the practice of using key performance indicators (KPIs) to put hard numbers to the quality and efficiency of your support team. This is how you stop guessing and start making smart, data-backed decisions that boost customer happiness and keep them coming back.
Why Customer Service Measurement Is Your Growth Engine
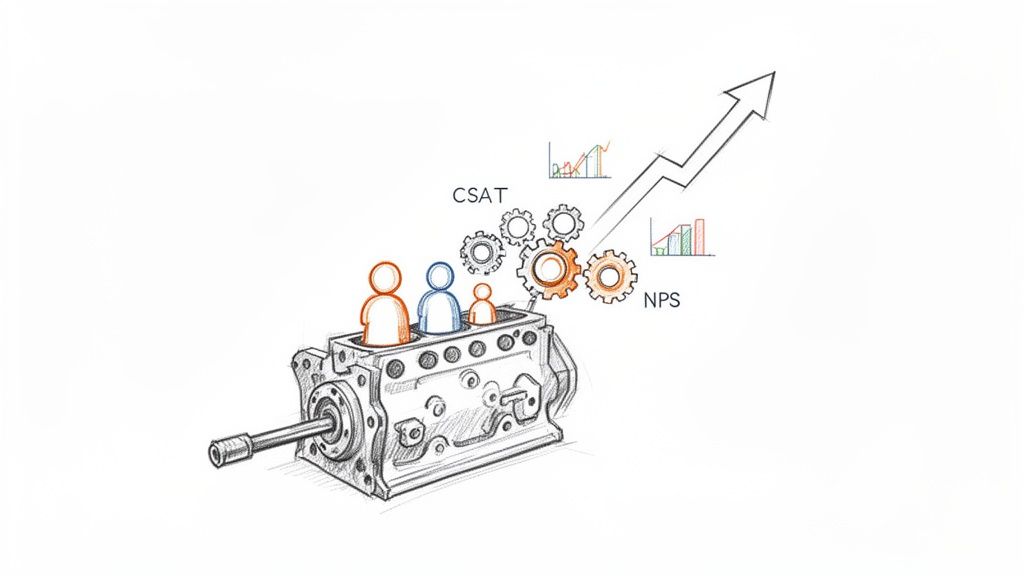
Too many e-commerce brands see customer service as just another cost center—a team you have to pay to deal with complaints and handle returns. That's a huge missed opportunity. When you start measuring your support properly, you can turn that reactive team into a powerful engine for growing your business.
Think about it: your support data is a live feed of your customers' real-world experiences, frustrations, and desires. Flying without that data is like trying to navigate a ship in a storm with no compass. Measuring your service quality gives you that compass, helping you find your way through the crowded e-commerce world.
Connecting Data to Dollars
Every metric you track tells a story, and that story always leads back to your bottom line. When you focus on improving your service KPIs, you’ll see real, tangible results.
- Boost Customer Loyalty: Incredible service makes you stand out. A whopping 93% of customers say they're more likely to buy again from a company that gets support right.
- Increase Lifetime Value (LTV): Happy customers don't just stick around; they tend to spend more over their lifetime, which is a massive win for your brand.
- Improve Marketing ROI: It costs way less to keep a customer than to find a new one. By reducing churn through great service, you make every marketing dollar you spend go further.
Measuring customer service isn't about hitting arbitrary targets; it's about understanding the health of your customer relationships. Each data point is a clue that can lead to a more resilient and profitable business.
A New Competitive Battleground
The market is catching on. The whole customer experience management (CXM) industry is expected to rocket from $11.34 billion in 2022 to $32.53 billion by 2029. Why? Because 80% of organizations now believe they'll be competing mostly on the quality of their customer experience.
This signals a major shift away from just throwing money at ads and toward investing in service that delivers a proven return. You can read the full analysis on customer service statistics to see just how big this trend has become.
For store owners on a platform like Shopify, this data-driven mindset is non-negotiable. With support tickets piling up and customers demanding instant, personalized answers, you can't afford to operate on guesswork. Measuring your customer service gives you the clarity you need to not just survive, but to truly stand out and thrive.
The 7 Core Metrics Every E-commerce Store Must Track
Knowing you need to measure customer service is one thing; knowing what to measure is where the real power lies. For e-commerce stores, you don’t need to track dozens of obscure metrics. Instead, it’s about focusing on a core set of seven key performance indicators (KPIs) that tell a clear, compelling story about your customer experience and team efficiency.
These aren't just abstract numbers on a spreadsheet. Think of them as the vital signs for your business. A high CSAT score is like a strong, steady heartbeat, while a sluggish First Response Time could signal high blood pressure in your support operations.
Let’s break down the essential metrics that give you a complete picture of your service health.
1. Customer Satisfaction Score (CSAT)
The Customer Satisfaction (CSAT) score is your instant feedback loop. It answers a simple but critical question: "How happy was the customer with that specific interaction?" You measure it by asking customers to rate their experience on a scale, usually from 1 to 5 ("Very Unsatisfied" to "Very Satisfied").
This metric is a true cornerstone of customer service measurement. The average CSAT score across most industries hovers between 70-80%, but for e-commerce, the gold standard is 85%. A huge 73% of business leaders see a direct line between their customer service quality—often measured by CSAT—and the company's financial performance. It’s no surprise that 76% of support teams keep a close eye on this metric.
2. Net Promoter Score (NPS)
While CSAT measures the immediate feeling after one interaction, the Net Promoter Score (NPS) zooms out to gauge long-term customer loyalty. It asks the ultimate question: "On a scale of 0 to 10, how likely are you to recommend our brand to a friend or colleague?"
Based on their answers, customers fall into three distinct camps:
- Promoters (9-10): These are your brand advocates, the loyal fans who drive growth through word-of-mouth.
- Passives (7-8): They're satisfied but not exactly enthusiastic, making them vulnerable to offers from competitors.
- Detractors (0-6): These are unhappy customers who can actively harm your brand with negative reviews and feedback.
Your final NPS is calculated by subtracting the percentage of Detractors from the percentage of Promoters. In the competitive e-commerce world, any score above 50 is considered excellent.
3. First Response Time (FRT)
First Response Time (FRT) measures exactly how long a customer has to wait for an initial reply to their question. In an age of instant gratification, speed is everything. A long wait can quickly turn a minor issue into a major frustration, potentially costing you a sale or earning you a negative review.
For e-commerce, the benchmark for email support is typically under 12 hours, though top-performing brands aim for under 6 hours. Live chat expectations are even higher, with an ideal FRT of under 2 minutes. Driving this number down is one of the fastest ways to boost a customer's perception of your brand.
4. Average Resolution Time (ART)
Beyond that first reply, Average Resolution Time (ART)—sometimes called Time to Resolution (TTR)—tracks the total time it takes to completely solve a customer's issue, from the moment they open a ticket to the moment it's closed. A quick first response is great, but customers ultimately care about getting their problem solved.
A high ART can be a red flag. It might signal that your agents need more training, lack the right tools to resolve issues efficiently, or that your internal processes have some serious bottlenecks. Aiming for an ART of under 24 hours for email tickets is a strong, achievable goal for most e-commerce businesses.
5. Customer Effort Score (CES)
How easy do you make it for customers to get help? That's precisely what the Customer Effort Score (CES) measures. After an interaction, you ask a simple question like, "How easy was it to get your issue resolved?" on a scale from "Very Difficult" to "Very Easy."
Research has shown that reducing customer effort is actually a more reliable predictor of loyalty than simply trying to "delight" them. When an experience is low-effort, customers can find answers, solve their problems, and get back to their day. That seamlessness builds a powerful, positive association with your brand.
6. Ticket Resolution Rate
Your Ticket Resolution Rate is a straightforward measure of your team's productivity and overall effectiveness. You calculate it by dividing the number of solved tickets by the total number of tickets received over a specific period.
A consistently high resolution rate, ideally over 90%, shows that your team is effectively managing its workload and keeping up with demand. If you see this number start to dip, it might be a sign that your team is understaffed, or perhaps a new product issue is causing a surge in complex inquiries that are harder to close.
7. Cost Per Contact
Finally, Cost Per Contact (or Cost Per Ticket) helps you understand the financial efficiency of your entire support operation. To figure it out, just divide your total customer service costs—salaries, software, overhead—by the total number of tickets handled in a given period.
This metric is absolutely essential for scaling your business intelligently. By tracking Cost Per Contact, you can make informed decisions about when to hire more agents, invest in automation tools like MAILO AI, or update your help center to deflect common questions. The ultimate goal is to lower this cost without ever sacrificing the quality of your service.
For a deeper dive into these and other powerful metrics, check out our complete guide on essential customer support KPI examples.
Essential Customer Service KPIs for E-commerce at a Glance
To help you put it all together, here’s a quick-reference table. It breaks down the most important customer service metrics, what they measure, the e-commerce benchmark to aim for, and why they are so critical for your Shopify store's success.
| Metric (KPI) | What It Measures | E-commerce Benchmark | Why It Matters |
|---|---|---|---|
| CSAT | Immediate satisfaction with a specific interaction | 85% or higher | Provides a real-time pulse on service quality and agent performance. |
| NPS | Long-term customer loyalty and willingness to recommend | 50+ | Predicts repeat business, referral growth, and overall brand health. |
| FRT | The speed of your team's first reply to a customer | < 12h (email), < 2m (chat) | Shapes the customer's first impression and sets the tone for the entire interaction. |
| ART | The total time taken to completely resolve an issue | < 24 hours | Reflects your team's efficiency and the complexity of your internal processes. |
| CES | The ease of the customer's experience in getting help | "Easy" or "Very Easy" | Low effort is a strong driver of customer loyalty and repeat purchases. |
| Ticket Resolution Rate | The percentage of incoming tickets your team successfully solves | > 90% | Measures team productivity and the ability to keep up with customer demand. |
| Cost Per Contact | The total cost to resolve a single customer inquiry | Varies (aim to reduce) | Reveals the financial efficiency of your support operations, guiding hiring and tech investments. |
Tracking these seven KPIs will give you a robust framework for understanding and improving nearly every aspect of your customer service. They provide the data-backed insights you need to turn your support team from a cost center into a powerful engine for growth.
How to Collect Actionable Customer Insights
Knowing which metrics to track is one thing, but the real magic happens when you start gathering the data that brings those numbers to life. Great customer service measurement isn't about fancy, expensive software. It’s about building simple, repeatable systems to pull customer feedback and hard data straight from your helpdesk and Shopify store.
Think of it this way: your KPIs are the recipe, but the raw data points are the ingredients. You can’t create a masterpiece with stale ingredients, and the same goes for your measurement strategy.
Automating Quantitative Data Collection
The best data collection is the kind you don't even have to think about. It should just happen in the background, without piling more manual work onto your team's plate. This is where the tools you're already using—like your helpdesk and its Shopify integration—really shine.
You can easily set up workflows to grab those key quantitative metrics without much fuss:
- Post-Interaction Surveys: The moment an agent marks a ticket as "resolved," an email with a simple CSAT survey should automatically go out. This catches customers while the interaction is still fresh in their minds, giving you much more accurate feedback.
- Timed NPS Surveys: Schedule your Net Promoter Score surveys to be sent a set number of days after a purchase. This gives the customer enough time to actually use the product and form a real opinion on whether they'd recommend your brand.
- Helpdesk Analytics: Most modern helpdesks, including MAILO AI, have built-in reporting that automatically tracks operational data. This is your source for metrics like First Response Time (FRT), Average Resolution Time (ART), and Ticket Resolution Rate.
This infographic breaks down some key statistics around Customer Satisfaction, a cornerstone metric for any e-commerce brand.
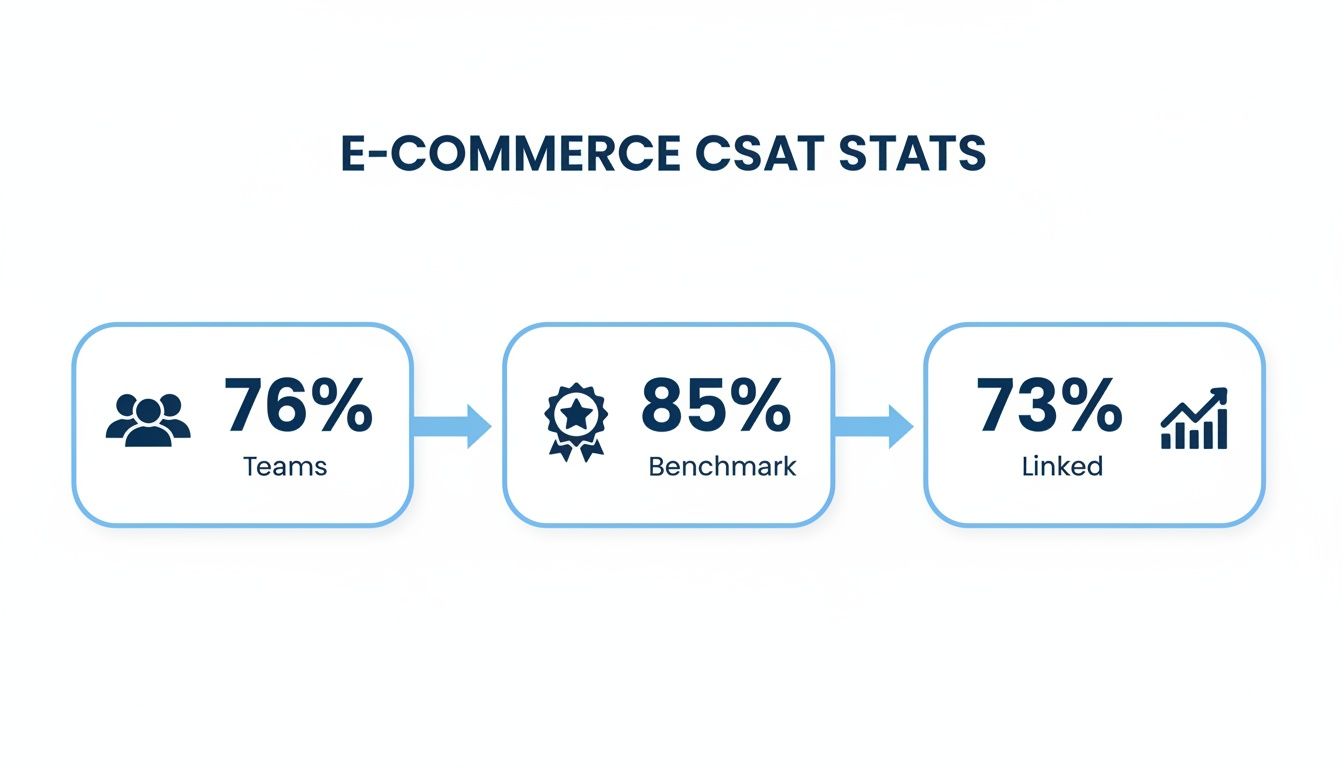
The data shows that while 76% of support teams are already measuring CSAT, the benchmark for e-commerce brands to strive for is 85%. It's a critical goal, especially when 73% of business leaders see a direct line between customer service and financial performance.
Capturing Qualitative Insights
Numbers tell you what is happening, but it’s the qualitative feedback that tells you why. That context is what turns a simple number into a smart business decision. It might be a bit harder to collect, but it's every bit as important.
Qualitative feedback is the story behind the score. A low CSAT score is a data point; a customer’s comment explaining why they were unhappy is an actionable insight you can use to prevent the issue from happening again.
A great place to start is by analyzing the free-form feedback you’re probably already getting.
- Support Ticket Sentiment: Many tools can now analyze the tone and language used in support tickets, helping you spot trends in customer frustration or delight. Are certain product names popping up again and again alongside negative words? That’s a huge red flag.
- Product Reviews: Keep a close eye on your Shopify product reviews and any third-party review sites. These are absolute goldmines of honest, unfiltered opinions about everything from product quality to the shipping experience.
When you combine automated number-crunching with a thoughtful analysis of what customers are actually saying, you get the full story. If you need some inspiration for your surveys, check out these excellent customer feedback form examples. This two-pronged approach ensures your measurement strategy isn't just about chasing numbers—it's about genuinely understanding the people who buy from you.
Building Your Customer Service Dashboard
Collecting all this customer service data is one thing, but staring at a spreadsheet full of raw numbers is just noise. It's overwhelming and nearly impossible to make sense of. This is where a well-designed dashboard comes in. It transforms that complex data into a clear, visual story you can understand in seconds.
Think of it as the dashboard in your car. You don't need a constant readout of every mechanical function. What you do need is your speed, your fuel level, and a warning light if the engine is overheating. A customer service dashboard does the exact same thing for your support team, giving you an immediate, actionable overview of its health.
Designing Your Dashboard Layout
A great dashboard isn't just a bucket of charts; it’s about showing the right data in the right way to tell a story. The layout should naturally guide your eyes to the most critical information first, so you can absorb key insights at a glance without getting bogged down.
A simple, powerful structure I always recommend is this:
- Top-Level KPIs: Put your non-negotiable, high-level numbers right at the very top. These are the vital signs you check every single day.
- Trend Analysis: Directly below those big numbers, place your trend graphs. This section is all about context—showing performance over time so you can spot patterns, seasonal shifts, or the effects of a recent marketing campaign.
- Team and Agent Performance: The bottom section should let you drill down into team and individual agent metrics. This is where you manage workloads, spot coaching opportunities, and recognize your top performers.
Your dashboard should be designed to answer key business questions instantly. It needs to tell a story that starts with, "How are we doing right now?" then flows to, "What trends are emerging?" and finally, "How is my team performing?"
Selecting the Right Visuals and KPIs
The visuals you pick are just as important as the data itself. The right chart makes information intuitive; the wrong one creates confusion. As you build your dashboard, it pays to get familiar with data visualization best practices to make your insights clear and impactful.
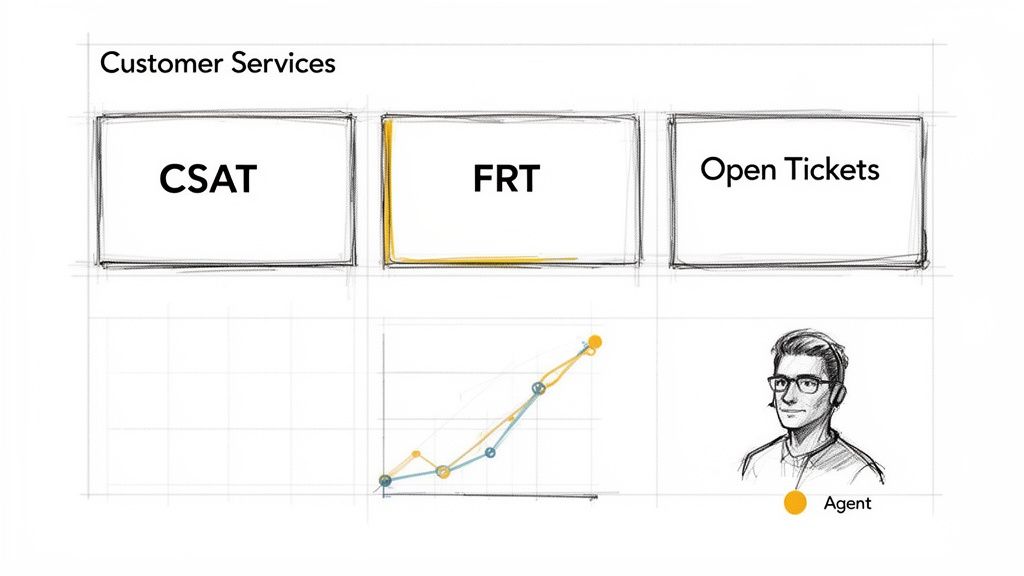
Here are the essential building blocks for any e-commerce support dashboard:
- Key KPI Scorecards: Use big, bold numbers to display your headline metrics like CSAT, Open Tickets, and First Response Time (FRT). These are your at-a-glance figures for the current day or week.
- Trend Graphs (Line Charts): Line charts are unbeatable for showing how metrics change over weeks or months. Did your resolution time spike after a new product launch? A line chart will make that painfully obvious.
- Comparison Charts (Bar Charts): Need to compare performance? Bar charts are your friend. Use them to see ticket volume by channel (email vs. social) or to compare resolution rates between agents.
- Ticket Status Breakdown (Pie or Donut Charts): A simple pie or donut chart gives you an instant snapshot of your ticket backlog, showing the percentage of tickets that are New, Open, Pending, or Resolved.
Many modern platforms, like MAILO AI, come with a built-in dashboard pre-configured with these essential visuals. If you want to see how powerful analytics are baked into today's tools, check out our guide on AI customer support software.
By combining these elements, you create a dashboard that’s more than just a measurement tool—it becomes your command center for making smarter, faster decisions.
Putting Your Measurement Data to Work
Collecting data and building a dashboard is just the starting line. Those numbers don't fix problems by themselves. The real magic happens when you turn those metrics into meaningful action—that "so what?" moment where your data becomes a clear roadmap for improving the business. This is how you transform your support team from a cost center into a proactive engine for growth.
Think of your data like a diagnostic tool. A doctor doesn't just glance at your blood pressure reading; they use it to recommend a specific plan, like a change in diet or more exercise. In the same way, your KPIs are signals that tell you exactly where to focus your energy to heal and strengthen your customer experience.
From Insight to Actionable Playbooks
The trick is to connect specific data trends to specific actions. Instead of constantly putting out fires, you can build repeatable "playbooks" to tackle common issues the moment your dashboard flags them. This systematic approach keeps everyone on the same page and helps you solve problems at the root.
Here’s what this looks like in practice:
- Your First Response Time (FRT) is lagging: This is a huge red flag. It means customers are left waiting, wondering if you even got their message. Your playbook? Set up an AI-powered auto-reply, like the ones in MAILO AI, to instantly confirm their message was received and is in the queue. It's a small touch that provides massive peace of mind.
- CSAT scores dip after a product launch: Don't just stare at the average score. The playbook here is to dig into the comments and sentiment data. Are people frustrated with a buggy feature, confusing instructions, or an unexpected shipping delay? The qualitative data will tell you exactly what's wrong so you can fix it.
- Resolution Time is high for a specific issue: If one type of problem is taking forever to solve, it probably means your agents are scrambling for answers. The playbook is to build a detailed internal knowledge base article or a saved reply that gives them everything they need in one click.
Driving Continuous Improvement with AI
This is where artificial intelligence becomes a game-changer, especially for refining your automated responses. A smart AI doesn't just send the same canned reply forever; it learns from every single conversation. By analyzing sentiment trends, it can figure out which automated answers are making customers happy and which ones are just causing more frustration.
This feedback loop is what drives real, continuous improvement. The AI can then tweak its responses to be more empathetic, accurate, and helpful, ensuring your automations feel less like a robot and more like a human with every interaction.
This is especially critical for a hybrid support model. While 79% of consumers are cool with getting help from generative AI, it has to be implemented smartly. AI and chatbots are brilliant at handling up to 58% of common issues like returns and cancellations. But they're not so great with complex problems, resolving only 17% of billing disputes effectively.
What's the bottom line? A whopping 77% of customers still want an easy way to talk to a human. This highlights the need for a balanced approach: let AI handle the simple stuff, but always provide a seamless handoff to a person for trickier cases. You can dig deeper into these customer experience trends and statistics to get a better feel for this balance.
Case Study: A Shopify Brand in Action
Let's make this real. Imagine a Shopify store that sells beautiful handmade leather goods. They started noticing a huge spike in tickets every Monday morning, all with the subject line, "Where is my order?" A quick look at their dashboard confirmed it: "shipping status" was their top ticket category, and it was killing their resolution time.
Instead of just hiring more people to answer the same question over and over, they let the data guide them.
- The Insight: They quickly realized the spike was coming from customers who placed orders over the weekend and were getting anxious.
- The Action: They used their support platform to create a simple automated workflow. The system was set to identify any incoming email with keywords like "shipping," "tracking," or "my order."
- The Result: The automation instantly replies with a personalized message, pulling the customer's latest order status and tracking link directly from their Shopify data. No human needed.
The impact was immediate. They saw a 40% reduction in shipping-related tickets within the first month. Better yet, their CSAT score for these interactions shot up by 15%. Why? Because customers got the info they needed instantly, without having to wait for an agent. This one simple, data-driven change freed up their team to focus on the complex, high-value conversations that actually required a human touch.
Your Customer Service Measurement Roadmap
Alright, let's move from theory to action. A great customer service measurement strategy isn't just about pretty dashboards; it's about building a system that actually plugs into your daily grind. This roadmap is designed to make it all feel less abstract and more like a concrete plan you can start today.
Think of it like building a toolkit. Each step gives you a new tool that works with the others. By the end, you'll have a fully functional system that makes customer service a measurable, improvable part of your Shopify store. Let's get to it.
Step 1: Integrate Your Helpdesk with Shopify
First things first: you need a single source of truth. Connecting your helpdesk, like MAILO AI, directly to your Shopify store is an absolute must. This simple integration syncs customer profiles and order histories, giving your team the full picture without having to jump between a dozen browser tabs.
This connection is the foundation for everything else. It makes sure the data you’re analyzing is clean and complete, tying every support ticket back to real customer behavior and lifetime value.
Step 2: Configure Baseline Automations
Next, let's clear out the easy stuff so your team can breathe. Pinpoint your most frequent, repetitive questions—you know the one, "Where is my order?" It's almost always at the top of the list. Set up automated workflows to handle these queries on the spot.
These automations can tap into your Shopify data to pull live order status and tracking info, giving customers an instant, accurate answer. Not only does this crush your First Response Time (FRT), but it frees up your agents to handle the tricky, high-value conversations that actually need a human brain.
Step 3: Activate Your Analytics Dashboard
Now it’s time to flip the switch and see what’s really going on. Turn on your helpdesk’s built-in analytics dashboard to get your first look at performance benchmarks. Don't aim for perfection here; the goal is just to get a baseline reading on core metrics like CSAT, FRT, and ticket volume.
A baseline isn't a judgment—it's a starting point. It gives you a clear "before" picture, allowing you to accurately measure the impact of every change and improvement you make from this day forward.
Step 4: Set Up Automated CSAT Surveys
With your dashboard up and running, you need to start feeding it fresh data. Set up your Customer Satisfaction (CSAT) surveys to automatically go out the moment a ticket is closed. This timing is crucial—it captures feedback while the experience is still top-of-mind for the customer, giving you much more honest and useful insights.
Step 5: Schedule a Weekly Dashboard Review
Finally, make looking at your data a habit. A dashboard collecting dust is useless. Put a recurring weekly meeting on the calendar—even if it's just 30 minutes with yourself or your lead agent—to go over the numbers. Look for trends, celebrate what’s working, and spot opportunities for the week ahead. This simple ritual turns measurement from a static report into a dynamic tool for getting better every single day.
Got Questions? We've Got Answers
Even with the best dashboards and a clear set of metrics, questions are bound to pop up. Let's tackle some of the most common ones we hear from Shopify brands diving into customer service measurement.
I’m New to This. Where Do I Even Begin?
If you’re just getting started, the key is to avoid analysis paralysis. Don't try to track a dozen different things right away.
Just focus on two: Customer Satisfaction (CSAT) and First Response Time (FRT).
CSAT gives you a direct, unfiltered look at how happy your customers are with your support. FRT tells you how quickly you’re getting back to them. Together, these two metrics give you a powerful snapshot of both quality and speed without drowning you in data. Nail these first, then you can start layering in more.
How Often Should I Actually Look at My Metrics?
This is a great question. The right cadence depends on the metric, but for most e-commerce stores, a simple tiered approach works wonders.
- Daily Pulse Check (5 minutes): Glance at real-time numbers like new tickets and FRT. This helps you get a feel for the day's workload and stay on top of any immediate fires.
- Weekly Huddle (30 minutes): Look at your trends. Are CSAT scores dipping? Is ticket volume spiking? This is where you spot patterns and identify issues before they become major problems.
- Monthly Deep Dive (1 hour): Step back and look at the bigger picture. Review long-term trends and overall team performance to make smarter, more strategic decisions for the month ahead.
The goal of measurement isn't just to report numbers; it's to find actionable insights. A low CSAT score tells you what happened, but a customer's comment in the survey tells you why.
How Do I Balance the Numbers with Customer Feedback?
Think of it like this: your data tells a story, and you need both halves to understand the full picture.
Quantitative data—the numbers like CSAT scores and resolution times—tells you what is happening. It’s great for flagging a problem. But it’s the qualitative feedback—the actual comments in tickets, survey responses, and reviews—that tells you why it's happening.
You absolutely need both. Use your metrics to pinpoint where the smoke is, then dig into the customer comments to find the fire. That's how you move from just tracking problems to actually solving them.
Ready to turn these insights into action? MAILO AI plugs right into your Shopify store to automate support, track your most important metrics on a clean dashboard, and help you deliver incredible service without all the manual work. Start your free trial today.